


Comparison Report Between AXIATA Berhad and DIGI.com for the Board of Directors of Top Glove
Introduction
AXIATA Berhad
Axiata, with 350 million users in 11 countries, is one of Asia’s largest telecommunications companies. Axiata works with the best in the country in terms of creativity, connectivity, and talents in fulfilment of its goal of being a next generation digital challenger by 2020.
In addition, by our operating entities, Axiata provides a wide variety of creative goods and services in cell networks, networking technology and digital services.
With the brand names “Celcom” in Malaysia, “XL” in Indonesia, “Dialog” in Sri Lanka, “Smart” in Cambodia, “Smart” in Ncell in Nepal, Axiata has managed interests in six telecom operators, with strategic interests in “Idea” in India and ‘M1’ in Singapore.
In addition, ‘edotco,’ an infrastructure firm of the Axiata Group, owns and maintains over 25 000 geographic portfolios in five countries to include telecommunication infrastructure. It is intended to be one of the leading area tourism firms and engages in responsible and sustainable business activities.
Axiata created ‘Axiata Digital’ in 2012 to capture exponential development in internet companies. Over the years a portfolio of 29 digital brands including 3 subsidiaries and 7 joint projects have been created by Axiata Digital to meet increasing mobile currency, mobile advertising, electronic shopping, entertainment, and education demands. Moreover, more than 25,000 employees are provided in Asia. (AXIATA, 2020).
DIGI.com
Digi Company is a mobile connectivity and internet resources provider that helps 11.7 million Malaysians make the best of a connected environment. They want to be Malaysians’ favorite digital life partner by offering appropriate, personalized, and engaging digital services that will empower all Malaysians’ digital lifestyles on our solid 4G+ network. They agree that digital media empowers people to change their life, create communities, and provide a brighter future for everyone. Digi, which is listed on the Malaysian stock exchange, is a subsidiary of Telenor Group, a multinational telecommunications company that is a pioneer in promoting innovative and ethical corporate practices.
Furthermore, they expect that a well-defined plan for long-term sustainable growth would build new prospects in digital, as long as they continue to provide the fundamentals on which the company is based, as well as consistent future-forward behavior, which will place Digi well to succeed, expand, and improve quickly in this new data-centric digital environment, and stay ahead of their industry. (DIGI, 2020).
Ratios Analysis
AXIATA Berhad
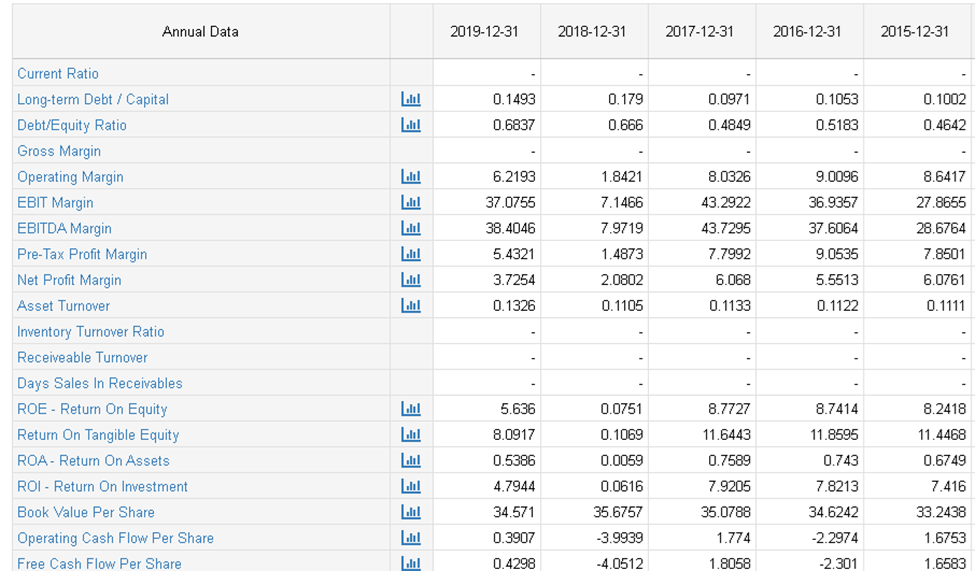
| Ratios | 2015 | 2016 | 2017 | 2018 | 2019 |
| ROI | 4.79 | 2.51 | 3.17 | 2.80 | 3.74 |
| Debt/Equity Ratio | 0.70 | 0.95 | 0.83 | 1.27 | 1.59 |
| EPS Ratio | 29.5 | 5.7 | 10.1 | (52.6) | 16 |
| Net Profit Margin | 6.0761 | 5.5513 | 6.068 | 2.0802 | 3.7254 |
In 2015, the ROI was 4.79, and in 2019, it was 3.74. AXIATA Bhd generates lower investment returns than the capital needed for the firm’s capital cost. It has a limited salary. A company that requires good surplus returns on new investments to continue to boost its value as it grows.
In 2015, the debt/equity ratio was 0.70, although it is now 1.59 in 2019. A large debt shares results in aggressive financing of a company’s debt creation. Income would be volatile as a function of the higher interest rate.
In 2015, the EPS was 29.5, and in 2019, it was 16. In relation to 2015, this is abysmal. In 2019, the net profit margin dropped, as it had in 2015 (AXIATA, 2020).
DIG.com Ratio Analysis
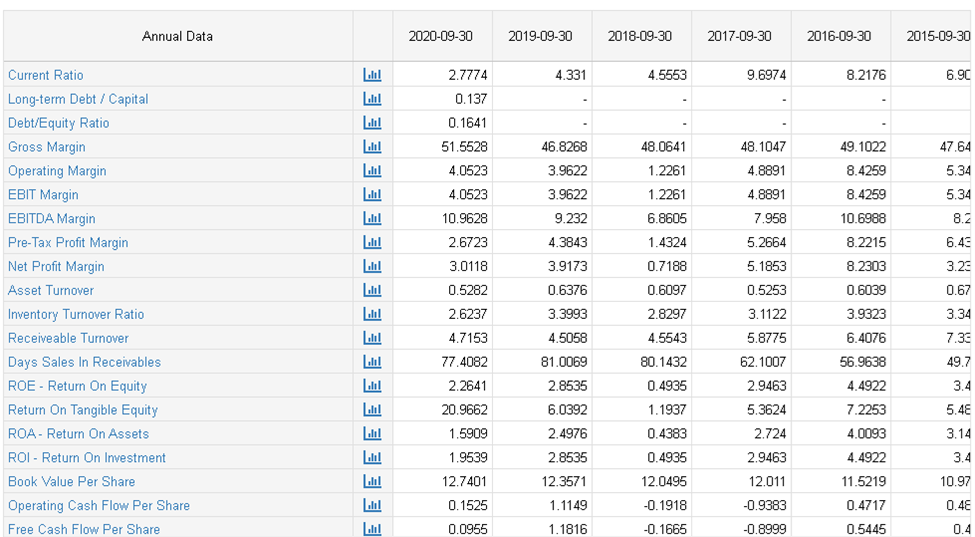
| Ratios | 2015 | 2016 | 2017 | 2018 | 2019 |
| ROI | 3.4 | 4.5 | 2.95 | 0.50 | 2.86 |
| Debt/Equity Ratio | 2.49 | 4.39 | 5.21 | 4.0 | 7.80 |
| EPS Ratio | 24.38 | 23.0 | 26.84 | 22.73 | 24.24 |
| Net Profit Margin | 3.23 | 8.23 | 5.19 | 0.72 | 3.92 |
In 2019 the ROI is 2.86 compared with 2018, which is 0.50 in comparison with 2015. In Digi.com Bhd, the capital available for the investment is produced at higher returns on investment than the Business costs. Excess returns are gained. A company that plans to continue producing positive surplus returns on new acquisitions in the future would increase its valuation with expansion. Digi.com Bhd generates income which do not equal the capital expense. If it expands it can destroy value.
In 2015 there was a debt/equity ratio of 2,49 relative to 7,80 in 2019. The large debt-to-equity ratio typically means that a business funded its debt development vigorously. Due to additional borrowing costs, which will lead to unpredictable profits.
In the past 12 months, the average growth rate of Digi.com Bhd’s EPS without NRI was -12.60% per year. Over the last 3 years, the average annual growth rate of EPS with no NRI was -4.30 percent. The average NRI growth rate for EPS during the last five years has been –6.10 percent per year. The average growth rate for EPS without NRI has been 3.70% a year in the last 10 years.
In 2019, net profit margin was better than in 2015 (Report, 2019).
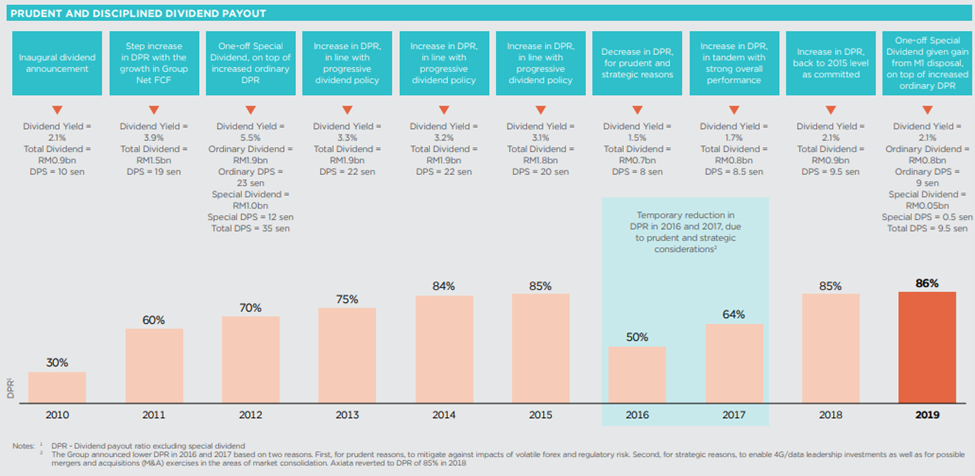
AXIATA Dividend Policy
The firm intends to pay dividends of at least 30% of its combined regular PATAMI and strives to steadily increase its payout ratio over time, subject to a variety of factors such as growth prospects, cash requirements and surplus, growth and expansion strategy, non-recurring conditions, and other factors considered important by the Board (AXIATA, 2020).
Axiata Group Bhd’s peak average trailing dividend yield for the last 13 years has been 4.62 percent. The lowest rate was 0.55 percent. And the overall rate was 3.13 percent.
Axiata Group Bhd’s cumulative dividends per share growth rate during the last 12 months was 15.80 percent per year. The average share growth trend over the last three years has been -17.60 percent per year. The average share-crop dividend yield during the last five years has been -20.00 percent per year (AXIATA-AnnualReport, 2019).
Axiata Group Bhd’s largest average three-year dividend per share rise during the last 13 years was 16.30 percent last year. This was the lowest annual rate of -28.60 percent. Per year, the number was -13,60 percent (AXIATA-AnnualReport, 2019).
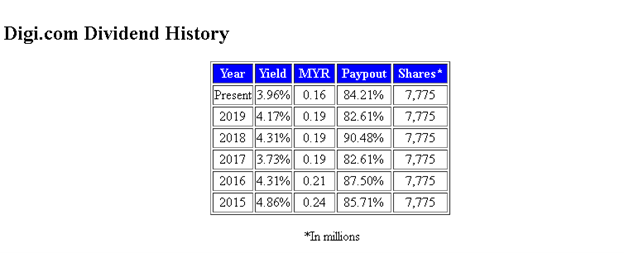
DIGI Dividend Policy
Since the fiscal year 2006, the Organization has paid semi-annual dividends in line with the minimum payout ratio of 50.5 percent of net income. Considering the Group’s consistently strong ability to generate cash, as well as greater visibility in the future of capital spending and operational cash flow, the Board revised this strategy and concluded that the minimum payout level was increased to 80 percent from 2010; payable quarterly.
Digi.com Bhd distributions per share have grown at a -12.00 percent annual pace over the last 12 months. In the last three years, the net dividend rate per share has been -4.00 percent per year. For the last five years, the cumulative dividend rate per share increase has been -6.70 percent per year. Over the past ten years, the average dividends per share have grown at a pace of 4.00 percent per year (DIGI, 2020).
Digi.com Bhd’s highest average three-year dividends per share development rate across the last five years has been 29.80 percent per year. The lowest annual statistic was -9.70 percent. And the annual average was 2.90 percent (Report, 2019).
AXIATA Investment Strategy
This year, expenditures totaling RM753 million, or 13.3 percent of service sales, have been made to enhance our network experience. The investments were largely targeted at improving network performance, capacity, and cell and fiber-based coverage to 4G LTE: 91 percent and LTE-A: 72 percent of the population, totaling 9610km.
It offers flexibility by engaging in or releasing Islamic paper on the debt capital sector. The Treasury oversees both debt and financing, cash control, and corporate finance matters at Digi. The Chief Treasury Officer reports to the Chief Financial Officer and is bound by Group Treasury Policy, which serves as the foundation for risk control and liquidity reporting.
The investment is in line with the company’s goal of becoming a Next Generation Technology Champion in 2022 to improve consumer service, develop non-urban areas in Indonesia, and grow the digital industry. External fund output was the primary source of these assets. 70% control in XL Axiata Data Center. Princeton Digital Group has reached an agreement. Robi will be listed on the Bangladesh Börse in 2020, according to plans. Mitsui & Co. Ltd. has agreed to provide Axiata Digital with a strategic minority stake worth USD 500 million. (AXIATA, 2020).
DIGI Investment Strategy
Telenor ASA, the company’s largest shareholder, owns 49 percent. Meanwhile, the second and third largest stockholders own 15% and 10% of the remaining stock, respectively. To make our analysis more important, we discover that the top two shareholders own most of the company, implying that they are too powerful to control decisions. According to our data, insiders own less than one percent of Digi.Com Berhad. It is a large corporation, but even a small proportional stake will bring the board and shareholders on board. In this case, insiders own stock worth RM204 million. It is always nice to see some insider property, so it might be worth looking into whether such insiders are being sold. Digi.Com Berhad, which owns 11% of the company, wields considerable power over the public. While this collective cannot be considered shots, the way the business is managed will undoubtedly have an impact. Today, public corporations own 49 percent of Digi.Com Berhad’s capital (Report, 2019).
Part B
- a) i) Ibrahim has unrealized capital gain of 200 x (AED18 – AED12) = AED1200. As he would want to protect the gain, he can either sell the stock or realize the profit while losing the upward potential of the stock or he can buy the puts and lock his profit. The main disadvantage of the 2nd option is the cost of the put which is 2 x AED1.5 x 100 = AED300 plus the brokerage commission.
- ii) If Ibrahim buys all puts, the minimum benefit he will create before taxes is determined as follows:
1put = 100 shares so 2 puts = 200 shares
Current Market Value of the stock = AED18 x 200unit = AED3600
Less: Purchase price of the stock = AED12 x 200unit = AED2400
Capital Gain = AED1200 (3,600 – 2,400)
Less: price of two puts option = AED150 x 2puts = AED300
Minimum Profit = AED900
Ibrahim’s benefit before taxes will be (AED18 – AED12) x 200unit = AED1200 if the stock is sold right away without hedging. It is worth remembering that the latter’s taxes (AED1200) are expected this year, while the former’s taxes (AED900) are due next year.
iii) If Ibrahim purchases two options and stock price moves to AED25, the market value of his investments on the expiration date of the option would be:
Value of stock = 200unit x AED25 =AED5000
Less: Purchase price of the stock = 200 x AED12 = AED2400
Capital gains = (AED5000 – AED2400)
= AED2600
Less: cost of puts = 2puts x AED150 = AED300
Net Profit = (AED2600 – AED300)
= AED2300
– The puts will be worthless upon expiration that makes Ibrahim to lose the cost of the puts. If says stock falls to AED11 (from their current price of AED18), Ibrahim will incur a loss on the stock but obtain on the puts. This will be calculated as follows:
Stock
Value of stock = 200unit x AED11 = AED2200
Less: Purchase price = 200 x AED12 = AED2400
Profit on stock = – AED200 (loss)
AED2200 – AED2400
Puts
Value of puts = (AED18 – AED11) x 200 = AED1400
Cost of the puts = 2 x AED150
= AED300
Profit on put = AED1100 (AED1400 – AED300)
Total profit = AED900 (AED1100 – 200)
- b) If Ibrahim believes that the market might fall in near future, he should buy the puts to protect the profit on his investment. However, if the market rises, the futures will expire worthless, and he will have to bear the cost of the puts. Finally, if the market is volatile but does not go below the trigger price of the puts during the period, the strategy will not be optimal as he will lose the cost of the puts.
The Hypothesis of an Efficient Market (EMH)
Introduction
An ‘efficient’ market is described as one in which many rational, profitable ‘maximisers,’ each attempting to predict the future market prices of individual shares, compete vigorously. Because of competition among the many experienced buyers in an efficient market, actual prices of individual securities are now often representative of the effect of experience on both recent occurrences and occurrences that the market anticipates will arise in the future. At any point of the efficient market, the actual price of a protection is therefore a rational estimate of its intrinsic value (Brown, 2020). (Bogle, 2016) defined in three distinct stages or strengths at which a business can be productive.
EMH in Strong Form
The EMH states in his strongest form that a business succeeds when the worth of a share is correctly and easily expressed in the market price, whether accessible readily to current or foreseeable acquirers (Brown, 2020). When the actual stock price is smaller than the value indicated by such private information, for instance, the knowledge owner will benefit from purchasing the shares from the trade phenomena. You will stay so until the over-supply of shares upsets the price backed by your hidden knowledge. They do not have to begin purchasing at this point to abandon the sector and maintain prices at the current pace of balance. It is regarded as the powerful shape of the EMH. It is the most rewarding and convincing EMH in principle, but it is seriously bad. It is difficult to prove empirically since the study needed would almost certainly fail to attract confidence in the related financial community field – insider dealers (Elton, 2019).
EMH Semi-Strong form
EMH is a kind of EMH composed of two elements. According to EMH, if all the knowledge accessible publicly is readily mirrored in the stock price but in less detail, a business would be competitive (Giamouridis, 2017). This is the word for the semi-fortified type of EMH. If the solid formula is the most science-based, the semi-structure is our common sense most attractive. It argues that the market will quickly absorb and pass pricing to a new level of balance as significant new knowledge is made available, showing the shift in supply and demand caused by the emergence of the Information. The semi-strong type of EMH exceeds the powerful theoretical effect, despite its lack of intellectual rigor. Analysis is less complicated than the solid form.
The identification of the related publicly accessible material is one of the problems with the semi-strong form. As clean as the word sounds, the fact is less so since there is no easy indication that shares are affected and does not impact details. Does the meaning of new information include the existence of the first link between two pieces of knowledge open to the public (Bogle, 2016)?
EMH in a weak form
In its 3rd, weak type, the EMH limits itself to a subset of publicly accessible information, including historical information on the share price. Here is the argument: New information must not be considered novel otherwise, but it must not be isolated from previous information. Therefore, any shares prices shift because of fresh knowledge cannot be predicted based on previous movements or prices and prices rise on a random path (Brown, 2020). To put it another way, a study of past markets cannot predict future rates.
Each of the three forms of EMH has different effects in the search of excess returns or returns that outperform the risks associated with holding investments.
Since the successive rates of a poor competitive environment are not connected to, surplus returns cannot always be improvements in the past. This research approach is called technical or map review since it relies on recent market trends without taking further history information into account (Brown, 2020).
If a market is semi-strong, the actual market price is the best practicable equal price measure, taking into consideration all knowledge commonly accessible on the costs and advantages of expenditure. Any review of publicly available data would not generate credible excess returns. This is a more divisive outcome than a poor EMH since it suggests that basic research cannot provide higher returns daily than risks. The importance and the significance, namely investment research and analysis, of a broad division of the financial services industry are questioned because of this result (Barber, 2020).
If a market is extremely efficient, the existing market rates are, considering all the applicable facts, whether accessible openly or not, the strongest potential neutral indicator. Excess returns, as we noticed, particularly when you bet on inside knowledge, are difficult to achieve. This enhances the exciting opportunity for others to gain from insider knowledge first. As tenting as this line of thinking in philosophy may be, it is almost difficult to examine it with a certain level of intellectual rigor (Elton, 2019).
Critics of EMH
Since Fama classic exposition was published in 1970, the Efficient Markets Theory has dominated the academic and business worlds. A continuous stream of research and reviews, both theoretical and experimental in nature, proceeded to back up EMH’s observations. According to, the EMH has more sound science evidence than any other economic proposition (Farhang Niroomand, 2020)
However, “strong arguments are reversed,” according to (Farhang Niroomand, 2020), an increasing amount of theoretical and experimental study in the two decades following Jensen’s declaration either debunked the EMH completely or attempted to demonstrate the statement was ‘not proven.’
The EMH critique offered a plethora of points, which are summarized below.
The belief that investors are reasonable and therefore value assets rationally – that future cash flow net present value is adequately discounted for risk through calculating net current prices – is not supported by evidence that investors are motivated further by:
- The stove’s instinct
- a churning theme in portfolios
- a tendency to respond negatively or unnecessarily to news.
- asymmetrical analyses of prior profit and cost triggers
In addition, some alleged anomalies in past stock market movements were uncovered. The most well-known of these are the “small company” effect, the January effect, and the average reversal.
Small Firm Effect: ‘ (Bogle, 2016) systematically recorded what had been anecdotally recognized for many years in a global study of long-term returns on US stocks, namely that shareholdings in small stock markets tend to yield higher returns than those in larger companies. Banz’s dissertation is followed by a variety of broad-based reports in the United States, Great Britain, and elsewhere. Surprisingly, these patterns were dramatically changed throughout the last twenty years of the twentieth century, and the “small cap” effect was even less pronounced in the century. Regardless of where or how this occurrence occurred, there was clearly a discernible trend or tendency that was much too consistent for the time being as a simplistic disturbance within the general framework of EMH.
The influence in January: Following the ‘tiny business’ theme, it was also observed that small cap stocks accounted for nearly all net production in January. It was once again the apparent motif to be arbitrated away under EMH. As one writer remarked somewhat sarcastically, the coming year of January may not be labelled as newsworthy.
Reversal of mean: This term relates to the proclivity of stocks, sectors, or individual securities to revert to a long-term average over a corresponding interval of over or underperformance after a sustained phase of under- or output. This has been taken up in detailed research by (Metghalchi M, 2019), who show that if a portfolio of ‘severe winners’ defined as the most profitable US shares over the previous three years had been formed each year since 1933, there would have been poor earnings over the next five years, while a portfolio of ‘extreme losers’ would have been very strong over the same period.
A note of caution regarding the discussion of the EMH
Under the EMH, an unbridled investor is unlikely to make unreasonable returns. Stale information may be quickly detected so to determine a surplus profit, the cost involved in keeping a share must be correctly calculated. Although there has been more in this region since the 1960s, the risk measure in the form of investment holdings has yet to be defined, commonly accepted and clinically verifiable. Price irregularities are more noticeable than real since they rely on inaccurate estimates of risk, proponents of EMH may claim.
Conclusion
The Efficient Markets Theorem demonstrates that efficiency can be split into three stages depending on how well information is converted into prices at the present time. The bad sort merely states that all experience of prior pricing is already contained in the current prices, which implies that any subsequent market change is a reaction to fresh facts and therefore cannot be anticipated by previous prices. All official information is now included in the half-strong price and any public or private information is now substantially diminished.
In the 70s and through much of the 80’s, the EMH was struggling with both theoretical and empirical issues. Yet it remains the most accurate model of how financial markets work for the most developed economies in the world.