


Introduction
In an attempt to assist in overcoming the economic crisis facing the nation of Ukraine, the International Monetary Fund (IMF) in April 2014 gave a conditional loan of $ 17.01 Billion (IMF, 2017). This intervention came with the objective of attaining external and economic stability, sustainable economic growth and strengthening economic governance and transparency through several reforms. The intervention of IMF has had and may continue to have a significant impact on the Ukrainian aggregate demand for goods and services as well as that for money. These effects can only be understood on the bases of precise information of the financial position of Ukraine before the intervention as well as an analysis of the milestones that the state has come after the financial injection done by the IMF into its economy.
The position of Ukraine before the intervention
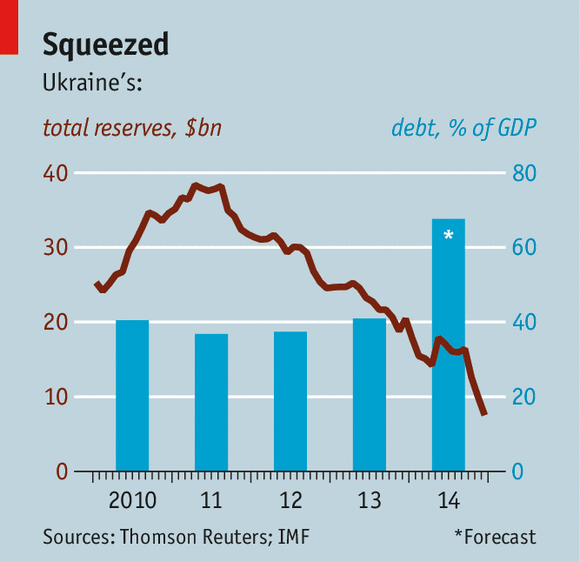
At the time the loan to Ukraine was approved, the nation was undergoing a major financial crisis. According to the IMF, the crisis comprised of overvalued exchange rates alongside loose fiscal policies in major government-owned institutions resulting in a significant deficit. As such, the nation was steadily increasing its debts, depleting it’s international and facing recurrent hardships with external finances. These issues, in turn, made the nation vulnerable to political and ultimately financial shocks. It was this vulnerability that the new Ukrainian government sort of dealing with through the reforms that would make ideally boost the production and consumption capacity of the nation for a more stable, sustainable and balanced economic performance and growth (IMF, 2014).
To be more precise, the government of Ukraine through the 2014 economic reforms sort to reach a number of goals. First, the government was set out to reach a flexible exchange rate. This was to be achieved through alignment of minimum wages and government consumption with national productivity and growth yielding a more competitive market and reserves’ increment — second, the government sort to attain increased investment through restored confidence in its financial system. Here, rather than just injecting money into the economy, more strict regulation and supervision became a necessity. The government also sort to meet the national short-term financial obligations and to reduce fiscal deficits gradually. This would, in turn, stabilize budgeted revenues and through medium-termed fiscal policies attain equitable redistribution of budget burden. Achieving a self-sustained energy sector was also an objective in the reforms financed by the IMF Loan to Ukraine. Ultimately, the government was also tasked to implement the reforms through amended tax policies, public expenditures and other public policies that would help in the reduction of corruption and making private investment more appealing collectively yielding high yet sustainable economic growth (IMF, 2014). These goals have been, since 2014, attained as be seen through an economic eye via varies economic models as discussed below.
IS-LM BoP Model
This model measures the interaction between real national output (GDP) and nominal interest rates perceiving the economy to be made up of two markets; the output to market and the money market both which have respective demand and supply. This model, therefore, has two curves, the IS curve which measure the relationship between investment and saving and interest rates and the LM curve which measures the levels of liquidity and money demand alongside interest rates. The model takes the form of the graph shown below.
According to a report by the IMF, the economy of Ukraine after the increased money supply through the first phase of the IMF intervention greatly improved. This expansion, in regards to the IS-LM Model, would lead to increased GDP coupled with decreased interest rates as the LM curve shifts to LM1 as shown above. There would then be a movement along the IS curve yielding a new equilibrium at the point where the IS Curve meets the new LM curve.
The following table shows the movement in critical economic growth measures between the year 2014 and 2017 (Balance of Payments of Ukraine: Analytical presentation(according to BPM6), 2018).
| Indicator | 2014 | 2015 | 2016 | 2017 |
| GDP | -6.6 | -9.8 | 2.3 | 2 |
| Inflation | 24.9 | 43.3 | 12.4 | 10.0 |
| Public Debt | 70.3 | 79.7 | 81.2 | 89.8 |
| Current Account Balance | -4.2 | -0.3 | -3.6 | -3.7 |
Notably, the national income as measured by the GDP increased from -6.6 in 2014 to 3.2 in 2017. This marks an increment of about 148% which is quite remarkable. Likewise, the inflation rate decreased by 59.8% from 24.9%.
According to a report on euro fast, an online journal, as early as October 2015 signs of economic recovery were already evident. According to Vladyslav, last year marked the most promising fiscal year in regards to inflation as the rate went below 10%, at 9.8%, for the first time since the 2013 financial crisis. Notable, in 2018, the real annual wage grew increasing consumer demand. However, the National Bank of Ukraine increased applicable interest rates making saving more attractive. As both saving and consumption rates went high, national output levels went up as inflation rates went down.
Ukraine’s Balance of payment as at 2014 was $ -13.3 Million. This means that before the IMF intervened the nation was operating at a negative balance of payment implying an imbalance between its imports and exports. The trend of Ukraine’s balance of payment (Comprising of the current account, financial account and capital account) since 2014 is as shown in the table below (Balance of Payments of Ukraine: Analytical presentation(according to BPM6), 2018).
| 2014 | 2015 | 2016 | 2017 | 2018 | |
| Current account (a) | -4 596 | 1 616 | -1 340 | -2 442 | -4 510 |
| Capital Account (b) | 400 | 456 | 92 | -4 | 37 |
| Financial account (C) | 9 111 | 1 223 | -2 594 | -5 012 | -7 350 |
| BOP (A+B-C) | -13 307 | 849 | 1 346 | 2 566 | 2 877 |
The increased 0 as is seen yielded the increased balance of payment by 121.62%. This growth is mostly attributable to increase in decline in the financial account balances from $ 9 111 to $ -7 350 since the current account balances decreased slightly by about 1.9% as capital investment increased by 90.8%.
AS-AD Model
The AS-AD economic model compares aggregate demand to aggregate supply trends in the commodity market, to include goods and services, of an economy. While Aggregate demand (AD) represents the total amount of goods and services consumable at different prices, Aggregate supply (AS) represent the total amount of goods and services that can be produced and made available for consumption at different prices. AS shows the relationship between prices and output supplied as AD shows the relationship between prices and real GDP. The point of intercession for the two represent the equilibrium price and quantity or the point at which given the current price levels, consumers would be willing and able to buy all that the suppliers would be willing and able to offer. The AS-AD model takes the form of the curve shown below.
AS-AD Curve
Ideally, an increase in the money supply would lead to increased aggregate demand as the consumers have more cash at their disposal. In the case of Ukraine therefore, increase the money supply would have been expected to increase the GDP of the country shifting to the AD curve to the right. To achieve a new equilibrium, there would be a movement along the AS curve as shown in the graph below.
Effects of increased money supply on aggregate demand and supply Curve
The path taken by the demand and supply curve at Ukraine after the increased money supply resulting from the loan received from the IMF was very similar to the model above. However, though the prices went, government regulations have ensured that the interest’s rate does not follow the free-market trend, thus limiting the potential for high inflation rates.
SOLOW Model
The Solow model is an economic growth analysis tool that examines changes in the level of output in regards to changes in labor population growth rates, savings, and technological advancement. This model is based on the assumption that technology levels are the same across all organizations taking part in an economy, the population grows at a constant rate, all consumers save a specific proportion of their income and consume the rest and future capital levels are a function of present capital and capital depreciation. To correctly analyses the long run effects of the loan by IMF to Ukraine, it would, therefore, be necessary to study the factor making up the model. The basic outline of the Solow model takes the form of the graph shown below.
(Solow Growth Model graph, adapted from Macroeconomics class review by Dr. E. Segura).
K* which is a capital stock shows that there is a single per capita and then the amount of per capita depreciation is the same as the investment amount. The capital stock is expected not to change if the economy is in this position of the capital stock since depreciation and investment just balances. Y* and K* is therefore known as a steady -state level of income and capital.
Population growth rate
The assumption that the population would grow at a constant rate has not been applicable. Over the years, the populations have in total decreased, though not in constant rates. The rates have however been very close and remained negative all through. Currently, the population of Ukraine totals to 43, 838, 350 and the annual growth rates since 2015 are as shown below (Worlometers, 2019).
| 2015 | 2016 | 2017 | 2018 | |
| Total Population | 44 657 704 | 44 438 625 | 44 222 947 | 44 009 214 |
| Growth rate | -0.50% | -0.49% | -0.48% | -0.49% |
In relation to labor, CEC Data observed that 8.3% of the Ukraine population as of June 2018 was unemployed, and 16, 531, 600 persons were in employment at the time.
Saving rates
With increased money supply, income levels in the nation went high. This would mean that though the proportion of income saved remained the same, the total amount saved would go up. As may have been predicted, saving rates in Ukraine have been increasing. For example, the rate went up from 5.3% to 8.5% between the first and second quarter of 2018. Notable, however, is the fact that the highest saving rate was reached in the third quarter of 2004 (35.9%) and its lowest in the first quarter of 2016 (3.8%) (CECData, 2018).
Technology
The global state of technology has been improving dynamically in the recent past, and Ukraine has not been an Island on this. Rather than just improving in the technological state, the nation has also significantly increased its investment in Research and development just like most states globally. Much still remains to be done and notable, the assumption that the level of technology across all organization the nation remains just an assumption. Research has however suggested that up to 47.3% of Ukrainian organizations have specialized research and development departments within them. In the year 2015, the year immediately after the intervention, the following demand for technology-related items would have been summarized as shown in the chart below (Strikha, 2016).
SOLOW Model deduction
This analysis shows that the population growth rate for Ukraine has declined slightly since 2014 as the saving rates and state of technology grew. On average, as savings rates grew alongside increased income levels, the GDP for the nation also went up.
Conclusion
Four years after the approval of the issuance of financial aid by IMF to Ukraine and issuance of the first phase of the same, its effects cannot be ignored. The short-run economic growth achieved by the loan approved and first issued in April 2014 was noticeable even as early as in the year 2015.
Over and above the economy of Ukraine has been able to grow its level of investment and savings, as well as consumption interpreting into growth. Flexible exchange rates have also been achieved, and with this, the balance of payment for the nation largely improved. The competitiveness of Ukrainian products may also be said to have improved, as may be seen from increased levels of exports. Regulatory policies have also been successful in curbing inflation in the midst of increasing demand for goods and services for example through tactical interest rate increment. On average, so far so good, would describe the gradual economic growth that has followed the intervention of the IMF with the financial flow in Ukraine only four years down the line.
Future predictions
If what has transpired in the past four years is anything to go by, the future is bright for Ukraine. This future is however entirely dependent on the ability of the nation to complete the already started reforms. To this effect, corruption is seen to be a significant threat to the promising growth of the economy of Ukraine, and fighting it might be the key to the bright future that the nation seeks to get to. Specific fiscal and monetarily measures, therefore, remain paramount in attaining the goals the new government had when it came up with the 2014 reforms and therefore getting the nation to the point the IMF may have desired to see Ukraine get to when the decision to offer aid was made (Kyiv, 2018).
For more academic help please check a wide range of services our Economics Writing Help team offers:
– Economics Assignment Writing Services
– Economics Essay Writing Services
– Economics Dissertation Writing Services
– Buy An Economics Research Paper