


Research has shown that low concentrations of phosphate creatine (PCr) in the blood can result in skeletal muscle and cardiac pathology because, together with adenosine triphosphate (ATP), they are high-energy molecules that quickly mobilise energy to power muscle action (Strumia et al., 2012). The primary determinant of performance in athletes is their ability to quickly break down these molecules to provide immediate energy to muscle action (Cooper et al., 2012). ATP is produced via the breakdown of glucose and glycogen (Dunn & Grider, 2022). These molecules can be broken down with (aerobic) or without (anaerobic) the presence of oxygen. During endurance exercises, such as sprinting, ATP and PCr reserves (immediate-energy system) are depleted quickly. As the demand for energy increases, the muscles stop relying only on the long-term energy system (aerobic from glucose breakdown) and immediate-energy system and activate a third energy supply system called the short-term energy system, the glycolytic energy supply (anaerobic) (McArdle et al., 2015). Therefore, it is anticipated that blood lactate levels will increase after a sprint exercise due to the glycolytic processes involved in ATP supply. The heart rate also increases to compensate for increased energy demands during sprinting. A few seconds after the activity, the short-term energy supply system contributes the highest amount of ATP in the equation.
This lab practical was based on the Wingate anaerobic test. According to McArdle et al. (2015), the test measures two forms of performance in anaerobic exercise, namely peak anaerobic power and anaerobic capacity. Peak anaerobic power refers to the highest power output of a sprinting athlete during a 5-s exercise interval, which is used to indicate the performance of the immediate-energy system (ATP and PCr) (McArdle et al., 2015). Peak power is measured as a product of force (exerted by the athlete) by the distance travelled by the athlete divided by time (5s). For instance, power output must correspond with velocity during cycling. Other variables commonly measured in this test include anaerobic fatigue (the percentage decline in power output during the test), which indicates the total anaerobic capacity to produce ATP via immediate and short-term energy systems. It is calculated by subtracting the lowest peak anaerobic power (5s) from the lowest peak anaerobic power divided by the highest peak anaerobic power times 100. It is expressed as a percentage. Finally, another commonly measured variable in Wingate anaerobic testing is anaerobic work/capacity, which is the amount of force exerted by the athlete times the total distance travelled in the 30s (McArdle et al., 2015). These variables were also measured in this lab practical session.
Rationale
Anaerobic power and peak output power are essential parameters in talent identification among athletes (McArdle et al., 2015). The rationale for undertaking this lab session was to identify sprinting talent in a sample of 26 athletes.
Hypotheses
H1: Blood lactate will increase significantly between before and after 6-s and 30-s sprints.
H2: Heart rate will increase significantly between before and after 6-s and 30-s sprints.
H3: Peak power output will not significantly differ between 30-s and 6-s sprints.
Methods
Participants
A total of n=26 participants took part in the lab practical. They had a mean age of 19 years, an average height of 1.78m, and an average body mass of 78.78kg. A majority of the participants were male (91.67%).
Procedure
The practical began by measuring the participants’ body weight in lightweight clothing with all accessories removed using an electric scale. Their height was also taken at the same time using a stadiometer. Afterward, the participants were asked to warm up before the actual test. The warm-up stage comprised three phases. The first phase entailed participants cycling (cycle ergometer) at 60 revolutions per minute (rpm) for 3 minutes; females cycled at a power of 60W or 1kg resistance, whereas males cycled at 90W or 1.5kg resistance. In the second phase, the participants were asked to stop cycling briefly, and the test weight was added, followed by raising away of the basket. Then participants were asked to continue cycling. The final phase was the warm-up sprint, whereby each participant was asked to cycle at 60 rpm with a countdown of 3s. Immediately before the countdown began, the basket was still raised with no resistance. Soon after it began, the instructor lowered the basket and asked participants to accelerate from 60 rpm to maximal speed within the 3s (countdown used). Immediately after the 3s lapsed, the participants were asked to decelerate back to 60rpm, whereby the weight was raised away again. Participants were asked to continue cycling at 60rpm for another minute before they were ordered to stop. After the 4-minute warm-up was over, the heart rate was measured using polar heart rate monitors, and the blood samples were taken (for blood lactate) at this point. During the test, participants were asked to start cycling at 60rpm without the weight for 10s. Afterward, on a countdown, the participants were asked to accelerate to maximal velocity for 6s (submaximal exercise). After 1 minute of the sprint, the heart rate was measured, and another blood sample was taken. The measurements were also taken after 5 minutes. The same procedure (apart from measuring body height and mass) was repeated in another sprint of 30s (maximal exercise). In other words, in the first procedure, the sprint was made for 6s, whereas in the second procedure, the sprint was made for the 30s. Peak power output and mean power were measured and recorded in each sprint test.
Analytical Techniques
Further, one-way ANOVA was used to compare heart rate and blood lactate at different points, namely before, one minute after, and five minutes after the exercise. Same-sample t-tests were also used to compare peak power output and mean power between the two types of sprints (6-s versus 30-s). Descriptive statistics were also used in the analysis.
Results
Heart Rate and Blood Lactate
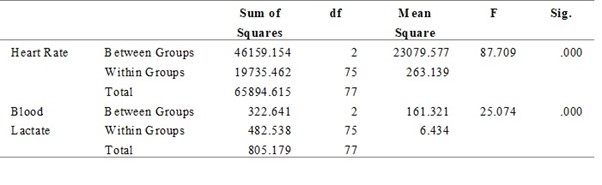
A one-way ANOVA was used to compare heart rate and blood lactate levels between the different time points (pre-test, 1-minute post-test, and 5-minutes post-test) for the sub-maximal sprint (6-s). As shown in Table 1 below, there were statistically significant mean differences between different time points for both heart rate (F [2, 75] = 87.71; p=.00) and blood lactate levels (F [2, 75] = 25.07; p=.00). An LSD posthoc test revealed that pre-test, 1-minute post-test, and 5-minutes post-test differed statistically concerning heart rate, but only the pre-test and 1-minute post-test differed regarding blood lactate.
Table 1: Heart Rate and Blood Lactate Levels (6-s Sprint)
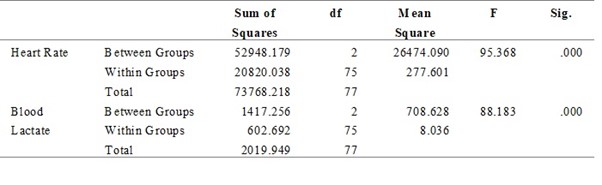
A similar trend was also noted in the 30-s sprint exercise for heart rate (F [2, 75] = 95.37; p=.00) and blood lactate (F [2, 75] = 88.18; p=.00). An LSD posthoc test similarly indicated statistically significant differences between all the three points in time for heart rate. Still, there were no statistically significant differences in blood lactate levels between the 1-minute post-test and 5-minutes post-test.
Table 2: Heart Rate and Blood Lactate Levels (30-s Sprint)
Therefore, H1 and H2 were accepted in this lab. Figure 1 below demonstrates the trend of heart rates before and after the test was implemented.
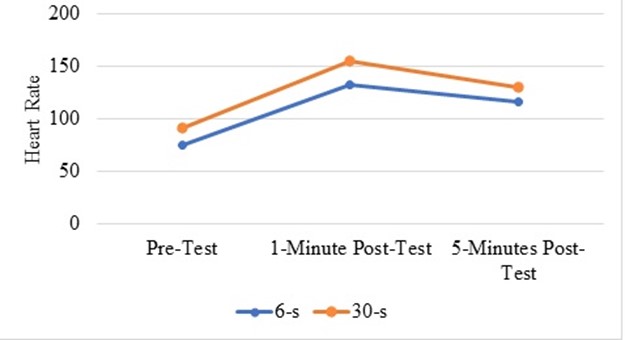
Figure 1: Heart rate trend between Pre-test and the 5-minutes post-test
As shown in Figure 1 above, the 6-s and 30-s sprints showed a similar trend, despite that the 30-s sprint demonstrated a relatively higher heart rate at all the three points in time.
Further, as shown in Figure 2 below, in both types of sprints, blood lactate increased sharply between pre-test to 1-minute post-test and then started to decline at the 5-minute post-test.
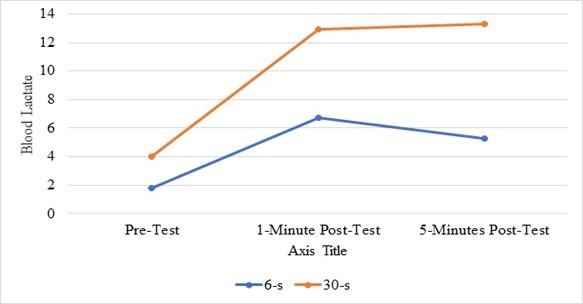
Figure 2: Blood lactate trend between Pre-test and the 5-minutes post-test
Peak Power Output
A same-sample t-test was used to compare peak power output between the 6-s sprint and the 30-s sprint. The difference between the two was statistically non-significant (F [1, 50] = .005; p=.95), indicating that peak power output does not differ with sprint duration, perhaps less than 30s.
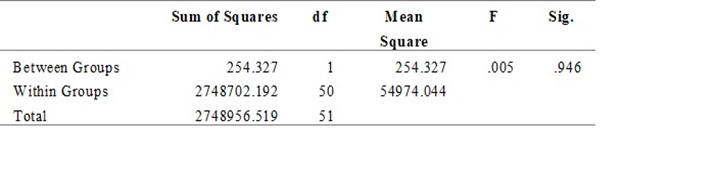
Table 3: Peak Power Output: 6-s versus 30-s
Therefore, the third hypothesis of this lab was also accepted. The following section discusses these findings in light of prior research.
Discussion
In this lab practical, all three hypotheses were accepted. First, it was shown that blood lactate increased significantly from the pre-test period to the 1-minute post-test and eventually slightly declined in the 5-minutes post-test period in both the 6-s and 30-s sprint times. These findings are consistent with Takei et al. (2020), who demonstrated lactate metabolism in athletes using the Wingate test. These observations were anticipated because the glycolytic energy supply was activated to meet energy demands during the sprint exercise, increasing blood lactate accumulation. Probably, blood lactate concentration remained relatively unchanged between the 1-minute post-test and the 5-minute post-test due to reduced demand for energy following the completion of the exercise.
Second, this lab also demonstrated that the heart rate increased significantly between the pre-test and 1-minute post-test for both sprint types and declined afterward. These findings are also congruent with prior studies showing that heart rate increases during anaerobic exercise due to increased demand for energy in the skeletal muscles due to rapid movement and muscle action (Lee & Chang, 2013; Patel et al., 2017). The body requires maintaining a constant supply of energy from the oxidation of glucose molecules to form ATP.
Finally, the finding that peak power output did not differ between 6-s and 30-s sprints is congruent with Moussa et al. (2003), who discovered that peak power output did not differ statistically between 6-s and 30-s sprints. Although Moussa et al. (2003) did not explain this trend, it is almost certain that power output would not differ within 25s because that is when the various energy supply systems are activated to meet energy demands.
Overall, the main limitation of this lab is the relatively small sample size. However, it appears that it did not threaten the internal validity and reliability of the study because the findings were in consistent with prior research.
David Amhurst
davidamhurst8@gmail.com