


AN INVESTIGATION INTO THE QUALITY OF SAND USED IN KIAMBU COUNTY AND ITS ENVIRONS AND THE EFFECTS ON PROPERTIES OF CONCRETE
CHAPTER ONE: Introduction
1.1Background
Kenya’s population is growing. Figures from the past two census exercises show a 23% increase in the number of people in the last 10 years. (MWANGI, 2019) With this comes the increased demand for housing as is evidenced by the rising number of construction projects. This is a lucrative business as more and more companies are signing up to be registered as contractors. As of 2013 the National Construction Authority had registered just under 34000 contractors. The construction industry plays a big role in socio-economic development by greatly contributing to the country’s Gross Domestic Product. As the construction industry grows, it has experienced a number of challenges. One of them has been the use of low quality construction materials, partly encouraged by a lack of strict enforcement and inadequate research into the quality of materials used. As a result failure and eventual collapse of structures is on the rise. According to Prof Alfred Omenya, more building developers are bypassing construction rules to meet the demand.
The price we pay for this is a growing number of incidences of building collapse. Hardly 3 months go by without a reported case. Kenyans are losing their lives and business premises unnecessarily to these tragedies.
There has been numerous research on the causes of building collapse in Kenya. Overloading, foundation failures, use of defective materials and corrosion are just but some of these. In a bid to fully understand the extent of this problem, the president of Kenya in 2015 made a directive to inspect structures in Nairobi County .The National Building Inspectorate was set up to address the growing risk of building collapse in urban areas. As of March 2018, it had inspected 5000 buildings and facilitated the demolition of 34 buildings on the brink of collapse. As of February 2018 nearly 600 building structures had been marked as unsafe for occupancy.
However, demolition cannot be the answer to this growing menace. It is an expensive undertaking and does not address the underlying issues. Of all the causes of building collapse, the quality of construction materials should be the easiest issue to address.
Concrete is a very important material in the construction industry which is spearheading infrastructural development in Kenya leading to the expected prosperity and growth of the nation. (CHUDLEY.R.GREENO, 1999)Which has also been found to be one of the causes of building collapse all over the world (AN, 2011)For this reason attention must be given to the quality of concrete constituent materials which control its strength.
Reported cases of collapsed buildings in Kenya are indicated in the appendix section;
1.2 Justification
The construction industry is yet to reach its full potential regarding its contribution to the Gross Domestic Product (GDP), employment and wealth creation. (Developmemt, 2018) This is owing to a number of challenges facing the industry. Quality of construction materials has been cited as one of the major causes of failure in concrete structures. In Kenya this has contributed to the failure and eventual collapse of various structures, leading to losses of lives and investment. Previous studies have focused on investigation of already constructed or collapsed buildings which is not a sustainable tactic in combating this. It is only after building failures that such issues of quality of materials come to light. More effort needs to be put into a thorough review of the integrity of materials before they are used. Whilst the quality of cement and steel can be assured by the manufacturers, who are strictly regulated, the quality of aggregates remains widely varied owing to the fact that they are sourced from a large number of areas. Aggregates, both fine and coarse, contribute towards about 75 percent of the volume occupied by concrete. Consequently, their characteristics influence to a large degree the properties of concrete. According to (Ngugi, 2014) information on the effect of silt and clay content and organic impurities present in building sand being supplied to Nairobi County and its environs is inadequate. Our study aims at investigating the Characteristics of fine sand used in and around Kiambu County whilst comparing their properties to those specified in various codes and their effect on the properties of concrete cast using it.
1.3 Problem statement
The Construction Industry policy draft of May 2018 (Developmemt, 2018)listed poor quality of works as a result of poor workmanship and use of substandard materials as one of the challenges that need to be addressed to enhance performance in the construction industry. Identification of the quality of materials used and an analysis on their properties in comparison to the set standards is of prime importance. If the quality of materials is substandard, then cases of building failures will keep on occurring. We aim to look at properties of sand used in and around Kiambu County and compare their properties to those specified in various recognized codes.
1.4 Objectives
1.4.1 Overall objective
To investigate the quality of sand used in Kiambu County and the effects on the properties of concrete.
1.4.2 Specific objectives
- To check for the presence of deleterious materials in sampled sand.
- Silt and clay content
- To determine the physical properties of sampled sand
- Texture and particle shape
- Fineness
- Specific gravity
- To analyze the correlation between workability of fresh concrete with silt and clay content together with fineness modulus of sampled sand.
- To analyze the correlation between compressive strength of hardened concrete after 7, 14 and 28 days of curing and silt and clay content together with specific gravity of sampled sand.
1.5 Research Hypothesis
- Sand used in Kiambu County satisfies all standards for fine aggregates from natural sources for concrete.
- Silt and clay content has a greater influence on workability than fineness modulus.
- Specific gravity has a greater influence on compressive strength of concrete than silt and clay content.
1.6 Scope and limitations
1.6.1 Scope
Our study will source sand from various vendors in Juja and subject the samples to laboratory tests to determine their silt and clay content, fineness, texture and particle shape, organic impurities and specific gravity. The workability of concrete cast using these samples will be measured, after which the compressive strengths after 7, 14 and 28 days will be measured. Fire resistance and durability against chemical attacks will not be investigated because these are rare occurrences in Kiambu County.
1.6.2 Limitations
1 The samples collected might not be a true representative of the sand used all over Kiambu County.
2 Other properties of concrete, such as resistance to weathering process and fire resistance, which are crucial towards the structural integrity of a structure, will not be tested.
3 The cost of collecting the samples might put a strain on our budget.
CHAPTER TWO: LITERATURE REVIEW
2.1 Properties of fine aggregates
2.1.1 Silt and clay content
2.1.1.1Definition
Silt is generally considered to be materials between 0.06 mm and 0.002 mm while Clay are materials less than 0.002 mm particle size (BS 882:1992, 1992).
2.1.1.2 Specifications on maximum amount
(BS 882:1992, 1992) Recommends that no more than a maximum of 4% silt and clay content for fine aggregates be used in concrete production ASTM’s allowable silt and clay content in sand used for concrete production is 10% by weight.
2.1.1.3 Effect on properties of concrete
In analyzing the effect of silt/clay on the concrete strength; if the silt/clay is found to increase the concrete strength it means silt/clay can partially replace fine aggregates. (IS, 2015). This will eventually reduce the cost of concrete production but if otherwise it will be useful information to all concrete designers and users to ensure that fine aggregates are free from silt/clay impurities. If present in fresh concrete silt/clay will interfere with the bonding of aggregates to cement. (IS, 2015). In hardened concrete, if the silt/clay comes into contact with water in air voids it can shrink or swell, either building internal pressure or leaving larger voids and weakening the concrete. Silt/clay being much finer than fine aggregates and having non-cohesive property with cement, fine aggregates and water it starts shrinking and swelling in concrete. This results in unwanted hairline or sometimes major cracks in the concrete depending on the percentage of silt/clay which should not exceed 4%. (BS 882:1992, 1992).The fine aggregates of high quality have high positive effect on the quality of compressive strength of concrete. (Hannah N N).
2.1.2 Fineness
2.1.2.1Definition
Fineness Modulus is a term used as an index to the fineness or coarseness of aggregate. This is the summation of cumulative percentage of materials retained in the standard sieves divided by 100.
2.1.2.2Specifications on maximum amount
(IS 383:” Specifications for Coarse and Fine Aggregates from Natural Sources for Concrete” ):
This publication deals with specifications for coarse and Fine aggregates from natural sources of concrete. It does not specify any limit for fineness modulus to be used in concrete. It divides the sand in four zones i.e. from Zone I to Zone IV. Zone I – Sand being very coarse and Zone 4 sand is very fine. It is generally recommended by code to use sands of zone I to Zone Iii for structural concrete works.
(AASHTO Designation : M6 – 93 Standard Specification for Fine Aggregate For Portland Cement Concrete):
It indicates that the fineness modulus of sand will not be less than 2.3 and not more than 3.1. Fine aggregate failing to meet the fineness modulus requirement as above may be accepted, provided concrete made with similar fine aggregate from the same source has an acceptable performance record in similar concrete construction; or in absence of demonstrable service record, provided, it is demonstrated that concrete of class specified, made with the fine aggregate under consideration, will have relevant properties at least equal to those of concrete made with the same ingredients, with the exception that a reference fine aggregate be used which is selected from a source having an acceptable performance record in similar concrete construction
(ASTM Designation: C33 – 93 – “Standard specification for concrete aggregates”):
The fine aggregate shall have not more than 45% passing any sieve and retained on the next consecutive sieve and its fineness modulus will not be less than 2.3 and not more than 3.1. The rest is the same as (AASHTO Designation : M6 – 93 Standard Specification for Fine Aggregate For Portland Cement Concrete)
(U.S.B.R): The code has specified that the fineness modulus of sand shall not be less than 2.50 and not more 3.0
2.1.2.3Effect on properties of concrete
Fineness modulus affects many concrete properties, including workability and finish ability. Usually a lower Fineness Modulus results in more paste, making concrete easier to finish. For the high cement contents used in the production of high strength concrete, coarse sand with a Fineness Modulus of around 3.0 produces concrete with the best workability and highest compressive strength.
2.1.3Texture and particle shape
2.1.3.1 Effect on properties of concrete
The shape and texture of aggregates affects the properties of fresh concrete more than hardened concrete. Concrete is more workable when smoothly and rounded aggregate is used instead of rough angular or elongated aggregate. Irregular and angular sand particles are common in river sand as a result of wave action and attrition in water. On the other hand, rounded particles are found in sand pits found on land where sand is mined.
A smooth surface can improve workability, yet a rougher surface generates a stronger bond between the paste and the aggregate creating higher strength.
2.1.4 Organic impurities
2.1.4.1 Definition
Organic impurities is considered as part of deleterious substances that may be found in aggregates. Impurities interfere with the processes of hydration of cement. The organic matter found in aggregates usually consist of products of decay of vegetable matter (mainly tannic acid and its derivatives) and appears in the form of humus or organic loam. (Neville, 2011)
2.1.4.2Specifications on maximum amount
The limitations on the amount of organic impurities allowed in fine aggregates are determined by the test method for organic impurities AASHTO T 21 and the test method for mortar strength AASHTO T 71. According to standard specifications, materials failing the organic impurities test are to be tested for the effect of organic impurities using the mortar strength test. The results of the test are the basis for acceptance or rejection of the fine aggregates
2.1.4.3Effect on properties of concrete
Organic impurities may delay setting of concrete, delay strength gain and in some cases cause deterioration. A high organic matter content can have a retarding effect on setting and hardening of concrete, which is caused by the high porosity resulting from the degradation of organic matter. (FANG, 2013)
A study in 2014 tested 27 sand samples from Nairobi County and its environs and concluded that the contribution of organic impurities towards compressive strength of concrete is 46%. However, silt and clay content had a greater contribution towards the compressive strength. An increase in organic impurities reduces the compressive strength of concrete. (NGUGI, 2014)
In the works of (NGUGI, 2014), sands sourced from eight supply points in Nairobi City County and its environs were investigated to determine the qualities of sands and their effect on the bond strength of concrete. Their results indicated that the bond strength between concrete and reinforcing bars decreased with increase in silt and clay content as well as presence of organic impurities.
According to (KOLAWOLE ADISA OLONADE) organic substances inhibit hydration process by forming a film layer between cement paste and aggregate, hindering adequate bonding and subsequently affecting concrete performance.
2.1.5 Specific Gravity
2.1.5.1Definition
Because aggregates have pores, both permeable and impermeable, the definition of specific gravity has to be carefully understood. As such there are several types of specific gravity.
- The absolute specific gravity refers to the volume of the solid filled material excluding all pores and can therefore be defined as the ratio of solid to the mass of an equal volume of gas-free distilled water, both taken at a stated temperature.
- If the volume of solid is deemed to include the impermeable pores, but not the capillary ones, the resulting specific gravity is pre-fixed by the word apparent. The apparent specific gravity is then the ratio of mass of aggregate dried in an oven at 100- 110oc to the mass of water occupying a volume equal to that of the solid including the impermeable pores. (Neville, 2011)
- Bulk specific gravity is used for calculation of the volume occupied by the aggregate in various mixtures such as concrete. Since it includes the water permeable void volume, it will be less than apparent specific gravity. It is defined as the mass of a unit volume of aggregate, including the water permeable pores, at a stated temperature to the mass of an equal volume of gas free distilled water at the stated temperature. (AASHTO T84). Bulk density is influenced by the degree of packing of the aggregate particles (grading)
2.1.5.2 Specifications on maximum amount
The recommended values for specific gravity of fine aggregates are about 2.7
2.1.5.3 Effect on properties of concrete
In Portland cement concrete, the specific gravity is used in calculating the percentage of void sand the solid volume of aggregates in computation of yield. Specific gravity of aggregates is a vital component in the determination of water cement ratio for a concrete mix (AASHTO T84.) Water cement ratio affects the workability of concrete whereby an optimum range of 0.45 to 0.6 is recommended, with higher values causing segregation and bleeding. It also affects compressive strength by reducing it with rising values of water cement ratio.
2.2 Aspects of concrete
2.2.1 Fresh concrete
2.2.1.1 Workability
Concrete which can be readily compacted is said to be workable but to say merely that workability determines the ease of placement and the resistance to segregation is too loose a description of the vital property of concrete.
Workability can also be defined as the amount of useful internal work necessary to produce full compaction.
Workability is a property determining the effort required to manipulate a freshly mixed quantity of concrete with minimum loss of homogeneity. (ASTM C 125 – 09a)
Workability is also a defined as that property of freshly mixed concrete or mortar which determines the ease and homogeneity with which it can be mixed, placed, consolidated and finished. (ACI 116R – 90)
The need for sufficient workability
Concrete must have a workability such that compaction to maximum density is possible with a reasonable amount of work or with the amount that we are prepared to put in under given condition. The need for compaction becomes apparent from a study of the relation between the degree of compaction and the resulting strength. It is convenient to express the former as a density ratio i.e. a ratio of the actual density of a given concrete to the density of the same mix when fully compacted can be called the strength ratio. Then the relation between the strength ratio and the density ratio is of the form shown in the figure below.
Figure 1.1 Relation between strength ratio and density ratio
The presence of voids in concrete really reduces its strength; 5% of voids can lower strength by as much as 30% and even 2% voids can result in a drop of strength of more than 10%.
Voids in concrete are as a result of entrapped air forming bubbles or spaces left after excess water has been removed. Volume of the latter depends on the W/C ratio of the mix or to a lesser extent, there may be spaces arising from water trapped underneath large particles of aggregate or underneath reinforcement.
The air bubbles are governed by the grading of the finest particles in the mix end are easily expelled from a wetter mix than from a dry one.
Factors affecting workability
- Cement content of concrete
- Water content of concrete
- Mix proportions of concrete
- Size of aggregates
- Shape of aggregates
- Grading of aggregates
- Surface texture of aggregates
- Use of AD mixtures in concrete
- Use of supplementary cementitious mask
- Cement content of concrete
The cement content affects the workability of concrete in good measure. The more the quantity of cement, the more will be the paste available to coat the surface of aggregates and fill the voids between them. This will reduce the friction between aggregates and smooth movement of aggregates during mixing, transporting, placing and compacting of concrete.
Also, for a given water-cement ratio, the increase in cement content will also increase the water content per unit volume of concrete increasing the workability of concrete.
- Water content of concrete
Water/cement ratio is one of the most important factor which influence the concrete workability. Generally, a water cement ratio of 0.45 – 0.6 is used for a good workable concrete without the use of any ad mixture (the constructor.org). Higher the Water/Cement ratio, higher will be the water content per volume of concrete and concrete will be more workable. Higher water/cement ratio is generally used for manual concrete mixing to make the process easier. However the water/cement ratio is reduced for machine mixing. (the constructor.org)
- Mix proportions of the concrete
Mix proportion of concrete mainly comprises the ratio of fine aggregates and coarse aggregates with respect to cement quantity. The more cement is used, concrete becomes richer and aggregates have proper lubrication for easy mobility or flow of aggregates. If low quantity of cement with respect to aggregates is used it will make the less paste available for aggregates and mobility of aggregates is restrained.
- Size of Aggregates
Surface area of aggregates depends on the size of aggregates. For a unit volume of aggregates with large size, the surface area is less compared to same volume of aggregates with small sizes. When the surface area increases, a need for cement quantity increases to cover up the entire surface of aggregates with paste. This will make more use of water to lubricate each aggregates.
- Shape of Aggregates
Shape of aggregates affects the workability of concrete. Round aggregates are easy to mix than elongated or irregular ones due to less frictional resistance. They also have less surface area compared to elongate or irregular shaped aggregates. This is advantageous in that, there will be less requirement of water for same workability of concrete.
- Grading of Aggregates
Grading of aggregates have a great effect on the workability of concrete. Well graded aggregates helps to reduce the voids in a given volume of aggregates. With less volume of voids, the aggregate particles slide past each other and less compacting effort required for proper consolidation of aggregates. (the constructor.org)
- Surface Texture of Aggregates
Surface texture has a considerable effect on the workability of concrete. With rough texture of aggregates, the surface area is more than the aggregates of same volume with smooth texture. Therefore concrete with smooth texture are more workable than with rough textured aggregates.
2.2.1.2 Setting
This is the transition process of changing of concrete from plastic state to hardened state. Setting of concrete is based or related to the setting of cement paste. Thus cement properties affect the setting time significantly.
Factors affecting setting
- Water Cement ratio
- Suitable temperature
- Cement Content
- Type of Cement
- Fineness of Cement
- Relative Humidity
- Admixture
- Type and amount of Aggregate
2.2.2 Hardened concrete
Hardened concrete is a product of binding and hardening of the concrete mixture which contains ingredients quantified in the appropriate proportions: binder (cement), coarse aggregate (gravel), fine aggregate (sand), water and optional additives.
2.2.2.1 Curing of concrete
Curing is the name given to procedures used for promoting the hydration of cement, and consists of a control of temperature and of the moisture movement from and into the concrete. The objective is to keep concrete saturated, or as nearly saturated as possible, until the original water filled space in the fresh cement paste has been filled to the desired extent by the products of hydration of cement. Hydration can proceed at a maximum rate only under conditions of saturation. (POWERS, 1958) Showed that it is greatly reduced when relative humidity within the capillary pores drops below 80%. Prevention of loss of water of the concrete is important because it affects the development of strength and durability. It affects plastic shrinkage, increase in permeability and reduced resistance to abrasion. Properly cured concrete has an adequate amount of moisture for continued hydration and development of strength, volume stability, resistance to freezing and thawing and abrasion and scaling resistance. (Z.ZEMAJTIS, 2005). The length of curing time is dependent on mixture proportions, specified strength, size and shape of concrete member, ambient weather conditions and future exposure conditions.
2.2.2.2 Strength of concrete
The strength of a material is its ability to resist force. Concrete is largely judged on the basis of its strength. The strength of any part of a concrete structure is important, the magnitude of importance depending upon the location of the element under consideration. Strength is the basis for acceptance or rejection of concrete in a structure. The strength of concrete is the ultimate load that causes failure.
The nature of strength of concrete is such that it is considered a brittle material, despite the fact that it exhibits a small amount of plastic action. This is because of the influence of voids in concrete on its strength and the mechanism of failure. High strength concrete is more brittle that normal strength concrete.
2.2.2.2.1 Compressive strength
The compressive strength of any material is defined as the resistance to failure under the action of compressive forces. Because concrete is an excellent material for resisting compressive load, it is used in structural members where the principal loading is compression.
2.2.2.2.2Factors affecting strength of concrete
- Water cement ratio
- Effective water in the mix
- gel/space ratio
- influence of aggregate/cement ratio
- influence of properties of aggregates
- effect of age on strength
- influence of temperature on strength
2.2.2.3 Durability
Durability of concrete may be defined as the ability of concrete to resist weathering action, chemical attack, and abrasion while maintaining its desired engineering properties. It is influenced by factors such as
- Cement Content
- Aggregate Quality
- Water Quality
- Concrete Compaction
- Curing Period
- Permeability
- Moisture
- Temperature
- Abrasion
- Carbonation
- Wetting and Drying Cycles
- Freezing and Thawing
- Alkali-Aggregate Reaction
- Sulfate Attack
- Organic Acids
2.2.2.4 Elasticity, Shrinkage and Creep
Concrete is, to a certain degree, elastic. When concrete is subjected to sustained loading, strain increases with time i.e. concrete exhibits creep. When subjected to load or not, concrete contracts on drying, undergoing shrinkage.
2.2.2.4.1 Elasticity
Deformation occurring during loading is considered elastic. The two components of concrete; hydrated cement paste and aggregate, when individually subjected to load, exhibit a sensibly linear stress strain relation. The reason for the curved relation in concrete, lies in the presence of interfaces between the cement paste and the aggregate and in the development of bond micro cracks at the interfaces.
Figure 2.1 stress vs strain of aggregate, cement and concrete
2.2.2.4.2 Shrinkage
When water moves out of a porous body which is not fully rigid, contraction takes place. The volume decrease in concrete cuased by drying and chemical changes is called shrinkage. Volume change is one of the most detrimental properties of concrete, which affects the long-term strength and durability.
Concrete Shrinkage is the change in length per unit length and is, therefore, a dimensional number expressed as percent. Shrinkage is time-dependent and its value includes plastic shrinkage, autogenous shrinkage, drying shrinkage, and carbonation shrinkage usually quantified in terms of micro strain which is equal to 1×10^-6 in/in or 1×10^-6 m/m. The term shrinkage is loosely used to describe the various aspects of volume changes in concrete due to loss of moisture at different stages due to different reasons.
Types of Shrinkage in Concrete
Shrinkage can be classified in the following way:
(a) Plastic Shrinkage in concrete
(b) Drying Shrinkage in concrete
(c) Autogenously Shrinkage in concrete
(d) Carbonation Shrinkage in concrete
2.2.2.5.3 Creep
Concrete creep is defined as: deformation of structure under sustained load. Basically, long term pressure or stress on concrete can make it change shape. This deformation usually occurs in the direction the force is being applied. When a load is applied to concrete, it experiences an instantaneous elastic strain which develops into creep strain if the load is sustained.
2.2.2.6 Impermeability
This is the property of concrete that cannot be pervaded by water, oil and other liquids with pressures. The pores relevant to permeability are those with a minimum diameter of 120 or 160nm, and they are connected. It is important on durability of concrete. The factors influencing it are water cement ratio, compaction of concrete, curing of concrete, age of concrete, cement properties, aggregate and use of admixtures. (Permeability of concrete and factors influencing it)
2.3 Tests done
2.3.1 Fine Aggregates
2.3.1.1 Silt and Clay content
Sieve analysis is done on sand samples to determine their degree of fineness as per (T27). The material retained on sieves between 0.06 mm and 0.002 mm is silt while Clay are materials less than 0.002mm particle size. (BS 882:1992, 1992)
2.3.1.2 Fineness of sand
Soil samples are graded using IS sieves (IS 383:” Specifications for Coarse and Fine Aggregates from Natural Sources for Concrete” ). After sieving, record the sample weights retained on each sieve. Then find the cumulative weight retained. Finally determine the cumulative percentage retained on each sieves. Add all the cumulative percentage values and divided with 100 then fineness modulus is obtained.
The samples were then categorized into four zones according to (IS 383:” Specifications for Coarse and Fine Aggregates from Natural Sources for Concrete” ).
2.3.1.3Texture and particle shape
The samples were subjected to texture and shape examination based on their appearance. Samples are grouped into two categories;
- samples with irregular and angular sand particles
- samples with rounded particles
2.3.1.4 Organic impurities
AASHTO No T21 and ASTM C40 both use a color comparison method where two glass bottles are filled. One with a sand sample and Sodium Hydroxide and the other with a standard color solution (Potassium Dichromate in Sulphur acid). The bottle with the sand sample is shaken and allowed to stand for 24 hours while the standard color solution Is prepared one hour before the 24 hours elapse. When the sample subjected to this procedure produces a darker color than the standard color, the sand under test shall be considered to contain possible injurious organic impurities.
2.3.1.5 Specific gravity
The complete fine aggregate specific gravity procedure as in AASHTO T 84 and ASTM C 128 can be summarized as follows: The mass of fine aggregates is determined in Saturated Surface Dry, oven dry and submerged states. These values are then used to calculate bulk specific gravity, apparent specific gravity and absorption.
- About 1000 grams of aggregate passing the No4 sieve are obtained. It is oven dried until it maintains a constant mass.
- A sample is dried to SSD condition while being repeatedly tested for SSD condition using the cone test.
- The specific gravity flask pycnometer is calibrated by filling it with water to the calibration line and its mass determined.
- About 500 g of the SSD aggregate is placed I the pycnometer and filled with water to 90% of its capacity.
- After agitation, water is added to return the pycnometer to its calibrated capacity.
- The total weight of the pycnometer, specimen and water is determined.
- The aggregate is removed from the pycnometer and dried in an oven until it maintains a constant mass and cooled for one hour
- Bulk specific gravity = A/(B-C)
Bulk SSD Specify Gravity = B/ (B-C)
Absorption= (B-A)/A *100
A= mass of oven dry sample in air (g)
B= mass of pycnometer filled with SSD sample and water (g)
S= mass of SSD sample (g)
2.3.2 Concrete
2.3.2.1 Fresh Concrete
2.3.2.1.2 Slump test
The concrete slump test is a test to determine the workability or consistency of concrete mix prepares at the laboratory or the construction site during the progress of the work. Concrete slump test is carried out from batch to batch to check the uniform quality of concrete during construction. Generally concrete slump value is used to find the workability, which indicates water-cement ratio, there are various factors including properties of materials, mixing methods, dosage, admixtures etc. also affect the concrete slump value. The slump test is influenced by a number of factors: Air content of concrete, Temperature of concrete, material properties like chemistry, fineness, particle size distribution, moisture content etc., chemical admixtures, the amount of free water in the concrete and time since mixing of concrete at the time of testing.
2.3.2.2 Hardened Concrete
2.3.2.2.1 Compressive test
This is the most common test performed on hardened concrete because it is the easiest to perform and also because most of the desirable aspects of concrete are qualitatively related to its strength. Mainly, though, it is because of the importance of compressive strength in structural design.
The strength test results may be affected by variation in: type of test specimen, specimen size, type of mould, curing, preparation of the end surface, rigidity of the testing machine and rate of application of stress. It is for these reason that testing should follow a single standard.
Standard specimens are tested at 28 days with additional tests often made at 3 and 7 days. Two types of compression test specimens are used: cubes and cylinders.
Cube test
The specimens are cast in steel or cast-iron mould of robust construction, generally 150mm (or 6 in.) cubes. The mould and its base must be clamped together during casting so as to prevent the leakage of mortar. The inside surface should be covered with a layer of oil to prevent the development of a bond between the mould and the concrete.
The standard practice prescribed by BS EN 12390-1:2000 is to fill the mould in one or more layers. Each layer of concrete is compacted by a vibrating hammer, or using a vibrating table, or by a square steel punner. Ramming should continue until full compaction without segregation has been achieved because it is essential that the concrete in the cube be fully compacted if the test result is to be representative of the properties of fully-compacted concrete. According to BS EN 12390-2 : 2009, after the top surface of the cube has been finished by means of a float, the cube is stored undisturbed for 16 to 72 hours at a temperature of 20 ± 5 °C (68±9°F)and a relative humidity preventing dehydration. At the end of this period, the mould is stripped and the cube is further cured in water or in a chamber with a relative humidity of not less than 95 per cent and at 20 ± 2 °C (68 ± 4 °F)
In the compression test, the cube, while still wet, is placed with the cast faces in contact with the platens of the testing machine, i.e. the position of the cube when tested is at right angles to that as-cast. According to BS 1881-116: 1983 the load on the cube should be applied at a constant rate of stress equal to 0.2 to 0.4 MPa/second (30 to 60 psi/second). ASTM C 39-09a prescribes a rate of 0.25 ± 0.05 MPa/ sec (35 ± 7 psi/sec). Because of the non-linearity of the stress–strain relation of concrete at high stresses, the rate of increase in strain must be increased progressively as failure is approached, i.e. the speed of the movement of the head of the testing machine has to be increased.
The compressive strength is defined as the strength of concrete below which not more than 5% of the test results are expected to fall
2.4 Previous Studies Done
In a study on the effect of silt content on the strength properties of concrete, 9 samples were casted with different fine aggregates found in River Jhelum at different locations; Qamarwari, Pampore and Lasjan, with a design mix of M30. Through an analysis of the results, it was concluded that with an increase in silt content by 0.15%, 1.85% and 2%, the compressive strength of concrete cast after 3, 7 and 28 days reduced by
Table 1silt content increase vs compressive strength decrease
| Silt content increase | Compressive strength decrease (%) after curing for | ||
| 3 days | 7 days | 28 days | |
| 0.15% | 0.15 | 0.08 | 0.17 |
| 1.85% | 1 | 0.22 | 0.75 |
| 2% | 1.15 | 0.3 | 0.92 |
(TAUSEEF BASHIR, 2018)
In a study in Nigeria to compare the compressive strength of concrete produced using sand from different sources, the research focused on beach sand, dredge sand, runoff sand, uphill deposit sand and river sand. The properties of sand tested were grading, silt content and salt content. It was concluded that the lower the Fineness Modulus, the higher the compressive strength, except for river sand. Sand with silt content 6.40 and salt content 8.03 performed better than that with silt content 8.70 and salt content 0.4. (Engr. Akinboboye F.A.O. MNSE, 2015)
In a study to determine the effect of fineness modulus on compressive strength of concrete, sand from 3 different quarries was compared in terms of compressive strength of concrete cast from it after 28 days and the results showed that sands with fineness modulus of 3.66, 3.15 and 2.52 gave compressive strengths of 21.1 Mpa, 22.1 Mpa and 21.5Mpa respectively. It was thus concluded that fineness modulus does not affect concrete compressive strength.
According to (1D.D.PARKHE, 2016), it was observed that river sand located next to populated areas contained more organic impurities and when washed, recorded higher compressive strength values.
In a study to investigate the effect of sand fines and water cement ratio on concrete properties, workability and compressive strength on concrete with 2%, 4%,6%, 8%.10% and 12% with water cement ratios of 0.55, 0.6 and 0.7 and design mix of 1:2:4 was tested. It was concluded that workability decreased as fines content increased, at the same level of fines content, workability increased as water content increased, up to 4% fines content compressive strength increased as fines content increased. Regression analysis showed that 80% of the variation in workability and strength was influenced by fines and water cement ratio. (A, 2018)
In the addition of silt fines at different ratios of 0%, 1%, 3%,5%,7% and 9% to sand and comparing its effects on the workability and compressive strength of concrete found that when silt content increases from 7% to 9%,compressive strength decreases from 5Mpa to 3Mpa. Thus effects of silt content start when silt content is >5%.
2.5 Research Gap
- These properties of sand have mostly been tested independently. Few studies exist where the overall effect of the different sand properties on the compressive strength of concrete is analyzed
- The sands used in Kenya, specifically Kiambu County, have rarely been analyzed to determine their effectiveness.
- An analysis of the correlation between workability and silt and clay content and fineness modulus has not been done yet.
- An analysis of the correlation between compressive strength and silt and clay content with specific gravity has not been done yet
CHAPTER THREE: RESEARCH METHODOLOGY
3.1 Introduction
Experimental study design was employed. Samples of sand from various sources were collected and tested to determine their material properties. Concrete mixes from the various sources of fine aggregates were subjected to tests on both the fresh and hardened concrete mix to determine the different strength and consistency effects.
This was the process that was followed
- Sampling and collection of sand
- Determination of texture and particle shape of sand
- Determination of specific gravity of sand
- Determination of gradation of the sand particles
- Determination of silt and clay content of sand
- Concrete mix design to emerge with the ratio of materials and target mean strength
- Determination of slump of the various mixes
- Preparation of cubes for later strength tests
- Establishing the properties of cured concrete specimens at 7 and 28 days after casting. The property to be tested will be compressive strength.
3.2 Sources of reference materials
The test procedures listed here were derived from relevant books, journals, articles, manuals and codes of practice.
3.3 Materials collection and preparation
The materials used in this study were sand, cement, coarse aggregates and water.
3.3.1 Cement
The type of cement used was the Portland cement of class 32.5, sourced from a local hardware shop in Juja
3.3.2 Sand
3.3.2.1 Sources of sand
Sand was sampled and collected from vendors in Juja. They were categorized according to their sources.
3.3.2.2 Sampling
Sampling was done according to practice D75 AASHTO No T2 (Standard procedure for sampling aggregates).
Through visual inspection, we ensured homogeneity of the sample prior to sampling. Procedure 5.3.3.2 of the code of practice was used. Our samples were made of at least 3 increments taken from the top, third at the midpoint and bottom third of the elevation of the stockpile. A board was shoved vertically above the sampling point to prevent material from rolling down and further segregating and biasing the sample. With the board in place, the outermost surface of the pile was scrapped off, then a shovel inserted perpendicularly to the angle of the pile into the freshly exposed material to obtain the sample. This process was repeated across the face of the stockpile until the recommended minimum field sample size is obtained.
3.3.3 Coarse aggregate
The same aggregates were used throughout the different concrete mixes.
3.3.3.1 Sampling of coarse aggregate
We refered to the method of riffling, as detailed in (Neville, 2011)
3.3.4 Water
Water was not a variable in our study. All water used will be sourced from JKUAT, Juja.
3.4 Determination of material properties of sand
3.4.2 Specific Gravity
The test method was derived from (T84)
Apparatus
Balance, pycnometer, mold, tamper
Procedure
The sample was thoroughly mixed to reduce it to the required size in accordance with AASHTO T248. The sample size was approximately 1000g of material passing the No 4(4.75mm) sieve size. The sample was dried to constant weight in an oven set at 110oC, then cooled at room temperature for 2 hours. After the cooling period, the sample was immersed in water at room temperature for 24 hours. We then decanted water from sample, avoiding loss of fines. The cone test was used to determine SSD condition of the sand. A specific gravity flask pycnometer was calibrated by filling with water at 73.4 ± 3°F (23 ± 1.7°C) to the calibration line. This was recorded as the weight of the pycnometer filled with water to the nearest 0.1g. The SSD sand was placed into the pycnometer and filled with water (set at 73.4 ± 3°F (23 ± 1.7°C)) to 90% of pycnometer capacity. We manually rolled, inverted, and agitated the pycnometer to eliminate air bubbles. This procedure was repeated several times to ensure that any entrapped air is eliminated. We brought the pycnometer to the pycnometer calibrated capacity with additional water. We then determined the total weight of pycnometer, specimen, and water and record the weight to the nearest 0.1g as Weight of Pycnometer with sample and water.
Calculations
- Bulk Specific Gravity (Gsb): The ratio of the weight in air of a unit volume of aggregate at a stated temperature to the weight in air of an equal volume of gas free distilled water at a stated temperature.
| 1 |
Where: A = Oven dry wt. B = SSD wt. C = Wt. in water
- Bulk SSD Specific Gravity (Gsb SSD): The ratio of the weight in air of a unit volume of aggregate, INCLUDING the weight of water within the voids filled to the extent achieved by submerging in water for approximately 15 hours, to the weight in air of an equal volume of gas-free distilled water at a stated temperature.
| 2 |
- Apparent Specific Gravity (Gsa): The ratio of the weight in air of a unit volume of the IMPERMEABLE portion of aggregate (does not include the permeable pores in aggregate) to the weight in air of an equal volume of gas-free distilled water at a stated temperature.
| 3 |
- Absorption (% Abs): The increase in weight of aggregate due to water in the pores of the material, but not including water adhering to the outside surface of the particles.
| 4 |
% Abs = [(B-A) / A] x 100
3.4.3 Grading (Sieve Analysis)
The procedure was as per (T27)
APPARATUS
Weighing balance, Sieves conformed to (M92)
Procedure
For Fine Aggregates
- The sample was weighed to the nearest 0.1g by total weight of sample. The weight was be used to check for any loss of material after the sample had been graded. Suitable sieve sizes were selected according to the specifications.
- The sieve sizes were nested in order of decreasing size from top to bottom and we agitated and shook the sample for a sufficient amount of time.
- The material retained on each sieve size was weighed to the nearest 0.1g. To ensure that all material entrapped within the openings of the sieve are cleared out a brush was used to gently dislodge the entrapped materials.
- Percentage of sand passing and retained were analyzed and grading curves plotted for comparison.
3.4.4 Silt and Clay content
Testing for silt and clay content was carried out as recommended in BS 812 and ASTM C117. Sun-dried sand samples were thoroughly washed in clean flowing water after which they were wet sieved to determine the amount of material finer than a 75-µm (No. 200) sieve in aggregate by washing. 50ml of 1% sodium chloride (NaCl) solution was added into the washing container as a catalyst in separation of silt and clay from sand. Each cylinder was covered with hand very tight and shaken rigorously for about 15 minutes after which the mixture was left standing for 3 hours. The silt settled and formed a layer which was used to determine the height of sand and results as percentage.
3.5 Mix design
3.5.1 Mix design using BRE method (D C Teychenné, 1988)
This process was divided into 5 stages
- Factoring in strength to obtain the free water cement ratio
- Factoring in workability to obtain the free water content
- Incorporating the results of 1 and 2 above to obtain the cement content
- Determining the total aggregate content
- Proportioning fine and coarse aggregates
Stage 1 selecting target water cement ratio
Calculation C1
First, we derived the margin M from the equation
| 5 |
Where M is the margin
k is a value appropriate to percentage defectives
s is the standard deviation
Calculation C2
We then determined the target mean strength
| 6 |
Where Fm= target mean strength
Fc = specified characteristic strength
M = margin
Next, a value was obtained from table 2 of BRE for the strength of a mix made with free water cement ratio of 0.5, according to the specified age, strength class of the cement and aggregate to be used. This strength value was then be plotted in figure 4 and a curve drawn from this point and parallel to the printed curves until it intercepted a horizontal line passing through the ordinates representing the target mean strength. The corresponding value for free water cement ratio was then read from the abscissa.
Stage 2 Selecting free water content
This involved selecting the free water content from table 2 of (D C Teychenné, 1988), depending on the type and maximum aggregate size to give the concrete a specified slump.
Stage 3 determining the cement content
This was determined from calculation C3
Calculation C3
|
|
7 |
Stage 4 determining the total aggregate content
An approximation was made using a value of 2.7 for uncrushed aggregate and 2.6 for crushed aggregates. The concrete density was then be obtained from figure 5 of (D C Teychenné, 1988), depending upon the free water content. From this estimated density of the concrete, the total aggregate content was determined using calculation C4
Calculation C4
| 8 |
Where
D= wet density of concrete (kg/m3)
C= Cement content (kg/m3)
W= free water content (kg/m3)
Stage 5 selection of coarse and fine aggregate content
This involved determining how much the total aggregate should consist of materials smaller than 5mm (coarse and fine aggregates). We used figure 6 of (D C Teychenné, 1988) which showed us the recommended proportions of fine aggregates depending on the maximum size of aggregates, workability level, grading of fine aggregate and free water cement ratio.
The final calculation C5, to determine the coarse and fine aggregate content, was made using the proportion of fine aggregate obtained from figure 6 and the total aggregate content derived in stage 4.
Calculation C5
| 9 | ||||
| 10 | ||||
3.6 Tests on fresh concrete
3.6.1 Slump test
Concrete slump test was used to determine the workability or consistency. The slump test was carried out as per procedures mentioned in (ASTM C143)
Apparatus
Slump cone, Tamping rod, scoop, Ruler or measuring tape, slump plate, Bucket of water and rag, sampling receptacle
Procedure
- The concrete was sampled, first we checked to make sure all water had been added, according to ASTM C172, and mixed it thoroughly. The test area was set up in a place that was free of debris and traffic, and it was made sure that our slump plate was on the most level surface possible. We applied oil to moisten the surface of the slump plate and inside of the slump cone, to keep concrete from sticking to it.
- The slump was put on the slump cone on the plate and we stood on the foot pieces.
- The first layer was filled to 50 mm to 15mm (1/3 of the cone by volume) making sure it was even inside the cone.
- We rod the layer 25 times, making sure to cover all th surface area inside the cone slightly angling the rod to get the edges..
- The second layer was filled to 150mm and 3mm (2/3 of the cone by volume) making sure the concrete layer was even.
- We rod the layer 25 times, and this time we made sure we penetrated the first layer by 25mm. Again, without tapping the side of the cone.
- The last layer was filled up to the top, where the concrete was slightly overflowing.
- We rod the layer 25 times and penetrated the second layer by 1mm. This top layer was kept full at all times, so we added a bit of concrete when it started to go below the rim of cone.
- We then stroked off the excess concrete and cleaned around the rim of the cone, making sure it is full.
- We put our hands on the handles of the cone and pushed down while stepping off of it. And kept it steady.
- We lifted the cone straight upwards with no sideways motion or twisting. The lifting process took 5 seconds.
- We flipped the cone upside down next to the slumped concrete, and placed our tamping rod on the top of the cone and over the slumped concrete. We measured from the displaced center to the rod, and recorded the slump to the 25mm.
- We cleaned the equipment and discarded the used concrete.
3.7 Tests on hardened concrete
3.7.1 Compressive strength test
The concrete strength test was done in accordance with EN 12390-3:2001 on 150 mm concrete cubes made in accordance with Part 2 of EN 12390 and cured by submergence in water. The testing procedure involved the application of a constant rate of loading within the range 0.2 MPa/s to 1.0 MPa/s without shock and increasing continuously at a constant rate of +10% until no greater load can be sustained.
At failure, the concrete cubes were examined physically to observe the failure type if satisfactory or not.
The compressive strength of the concrete was thus to be obtained by the equation
| 11 |
Where; fck is the compressive strength in Megapascals (N/mm2)
F is the load at failure in Newtons
Ac is the cross-section area of the concrete cube specimen on which the compressive force acts (150 mm x 150 mm).
The concrete cubes were tested at 7 and 28 days
CHAPTER FOUR: RESULTS
4.1 General Introduction
This chapter represents results from 4 sand samples subjected to tests such as specific gravity, silt and clay content, sieve analysis and particle shape. It further represents data from concrete cube tests using the Universal Testing Machine as detailed in the Methodology section.
4.2 Determination of material properties of sand
Four sand samples sourced from the supply point in Juja were subjected to preliminary testing before casting of concrete cubes for compressive testing was done. These preliminary tests were;
- a) Observations to determine particles shapes, texture
- b) Sieve analyses to determine degrees of finesses
- c) Testing for silt and clay contents in sand samples
- e) Testing for specific gravity
4.2.1 Texture and Particle Shape results
The four samples were subjected to texture and particle shape examination.
4.2.2 Specific gravity
Sand samples were subjected to specific gravity tests as detailed in IS (1970) equivalent to ASTM D854 (2014) for aggregates less than 10mm diameter using the pycnometer glass vessel.. The summary of results is
Sample 1- 2.26
Sample 2- 2.10
Sample 3- 2.26
Sample 4- 2.09
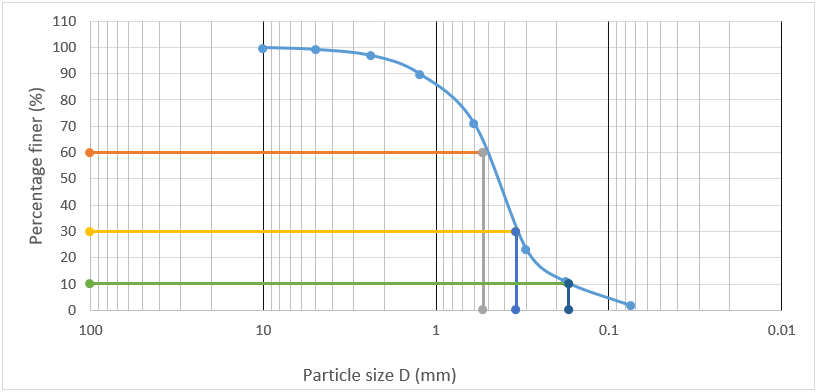
4.2.3 Sieve analysis results
Graphs from sieve analysis data are shown below.
Sample 1
Figure 3showing sieve analysis results for sample 1
Sample 2
Figure 4 showing sieve analysis results for sample 2
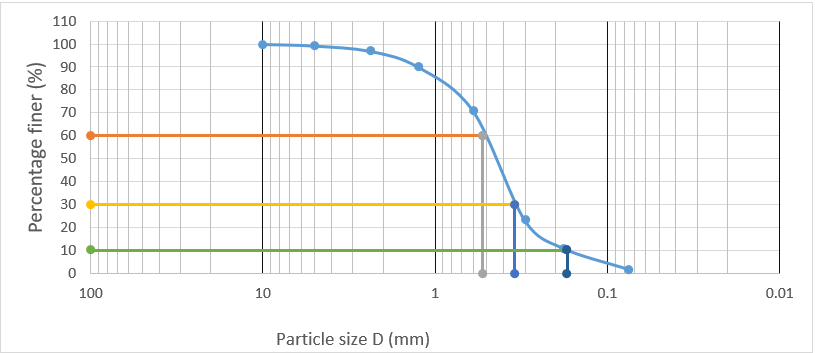
Table 2 showing coefficient of uniformity and coefficient of curvature for sample 2
| coefficient of uniformity | 2.755624 |
| Coefficient of curvature | 1.205753 |
Sample 3
Figure 5 showing sieve analysis results for sample 3

Table 3showing coefficient of uniformity and coefficient of curvature for sample 3
| coefficient of uniformity | 4.820913 |
| Coefficient of curvature | 0.676407 |
Sample 4
Figure 6 showing sieve analysis results for sample 4
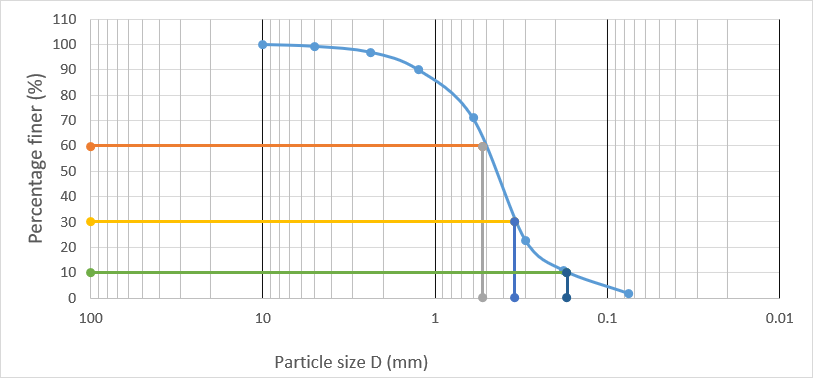
Table 4showing coefficient of uniformity and coefficient of curvature for sample 4
| coefficient of uniformity | 3.093807 |
| Coefficient of curvature | 0.853113 |
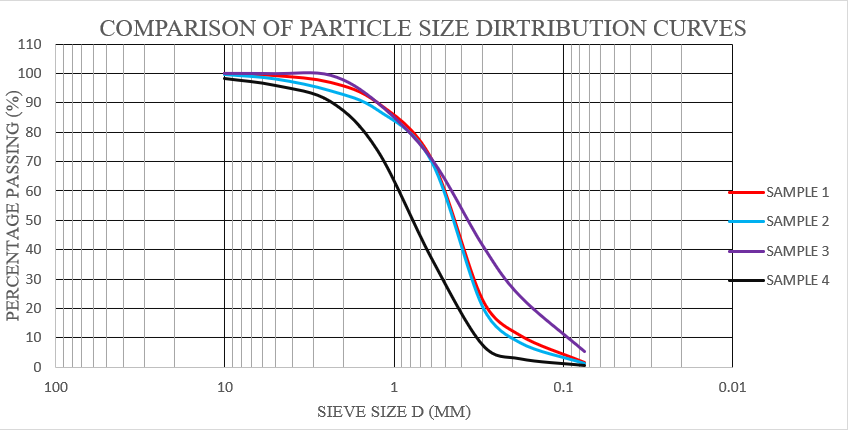
Figure 7showing comparison of particle size distribution curves for the four samples
4.2.4 Silt and clay content
It was found that the values of silt and clay content were 14.29, 9.09, 18.18 and 5.26 respectively.
4.3 Determination of material properties of coarse aggregate
4.3.1 Grading
Sieve analysis for coarse aggregate (3000g)
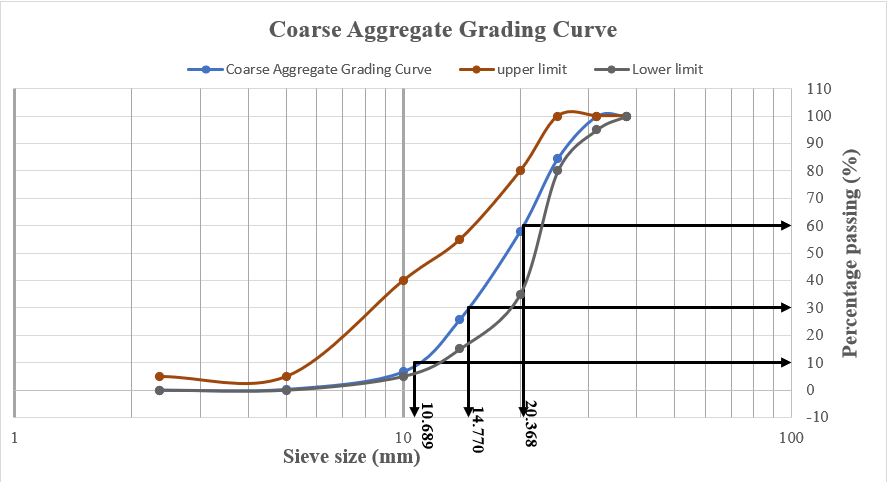
Figure 8 showing coarse aggregate grading curve
Uniformity coefficient Cu = = =1.906
Coefficient of gradation Cc = = = 1.002
The gradation curve lies between the upper and lower limit
4.3.2 Specific gravity
Specific Gravity of Coarse aggregate
The specific gravity was found to be 2.66 with a water absorption of 3.34%
4.4 Mix Design
4.5 Mix Design using BRE method
The concrete mix design was done according to BRE design of normal concrete mixes. A desired strength of 25N/mm2 was decided upon. For each sand sample, the calculated quantities are as shown in the tables below. A summary of the concrete mix design is shown in the chart in below.
Sample 1
| Concrete mix design form | Job title……………………………………… | ||||||||||
| Reference | |||||||||||
| Stage Item | or calculation | Values | |||||||||
| 1 | 1.1 | Characteristic strength | Specified | …25……………………………………XN/mm2 atX | ……28………………XdaysX | ||||||
| Proportion defectiveX ………………5………………………………………X%X | |||||||||||
| 1.2 | Standard deviation | Fig 3 | ………………………………………XN/mm2 or no dataX ……8……XN/mm2X | ||||||||
| 1.3 | Margin | C1 | (kX=X…………1.64…X)X ……………1.64…X×X …8…………X=X ……13.12……XN/mm2X | ||||||||
| or | X=X …………XN/mm2X | ||||||||||
| Specified | |||||||||||
| 1.4 | Target mean strength | C2 | XX …25……………X+X ………13.12…X=X ……38.12…XN/mm2X | ||||||||
| 1.5 | Cement strength class | Specified | 42.5 | ||||||||
| 1.6 | Aggregate type: coarse | Crushed | |||||||||
| Aggregate type: fine | Uncrushed | ||||||||||
| 1.7 | Free-water/cement ratio | Table 2, Fig 4 | ………0.52……………………………… X | ||||||||
| 1.8 | Maximum free-water/ | Specified | ……………………………………… | Use the lower value | |||||||
| ……// | 0.57 | ||||||||||
| cement ratio | |||||||||||
| 2 | 2.1 | Slump or Vebe time | Specified | SlumpX …………60-180……………………Xmm or Vebe timeX …………………XsX | |||||||
| 2.2 | Maximum aggregate size | Specified | …………20……XmmX | ||||||||
| 2.3 | Free-water content | Table 3 | ………………225…………………………………………… | 225 | kg/m3X | ||||||
| 3 | 3.1 | Cement content | C3 | …………225……… X÷X ……………0.52………………X= ……439.69…………Xkg/m3X | |||||||
| 3.2 | Maximum cement content | Specified | ……//……………Xkg/m3 | ||||||||
| 3.3 | Minimum cement content | Specified | …………………Xkg/m3 | ||||||||
| use 3.1 if ≤ 3.2 | |||||||||||
|
4439.69 |
|||||||||||
| use 3.3 if > 3.1 | |||||||||||
| 3.4 | Modified free-water/cement ratio | ………………//……………………………………………… | |||||||||
| 4 | 4.1 | Relative density of | ………………2.7………………………Xknown/assumed | ||||||||
| aggregate (SSD) | |||||||||||
| 4.2 | Concrete density | Fig 5 | X)X=X …2390………Xkg/m3X | ||||||||
| 4.3 | Total aggregate content | C4 | ………2390………… X–X ……439.69……… X–X ……225………X)X=X ………1725.31…Xkg/m3X | ||||||||
| 5 | 5.1 | Grading of fine aggregate | Percentage passing 600 µm sieveX ……29.2…………………………………………………………X%X | ||||||||
| 5.2 | Proportion of fine aggregate | Fig 6 | ……………………48…………………………………………………………X%X | ||||||||
| 5.3 | Fine aggregate content | …………………1725.31……… X×X…………0.48……………… X=X | 828.15 | Xkg/m3X | |||||||
| C5 | |||||||||||
| 5.4 | Coarse aggregate content | ……………1725.31…………… X–X …………828.15……………… X=X | 897.16 | Xkg/m3X | |||||||
| Cement | Water | Fine aggregate | Coarse aggregate (kg) | ||||||||
| Quantities per m3 | (kg)
439.69 |
(kg or litres)
225 |
(kg)
828.15 |
10 mm
|
20 mm
897.16 |
40 mm
|
|||||
Sample 2
| Concrete mix design form | Job title……………………………………… | ||||||||||
| Reference | |||||||||||
| Stage Item | or calculation | Values | |||||||||
| 1 | 1.1 | Characteristic strength | Specified | …25……………………………………XN/mm2 atX | ……28………………XdaysX | ||||||
| Proportion defectiveX ………………5………………………………………X%X | |||||||||||
| 1.2 | Standard deviation | Fig 3 | ………………………………………XN/mm2 or no dataX ……8……XN/mm2X | ||||||||
| 1.3 | Margin | C1 | (kX=X…………1.64…X)X ……………1.64…X×X …8…………X=X ……13.12……XN/mm2X | ||||||||
| or | X=X …………XN/mm2X | ||||||||||
| Specified | |||||||||||
| 1.4 | Target mean strength | C2 | XX …25……………X+X ………13.12…X=X ……38.12…XN/mm2X | ||||||||
| 1.5 | Cement strength class | Specified | 42.5 | ||||||||
| 1.6 | Aggregate type: coarse | Crushed | |||||||||
| Aggregate type: fine | Uncrushed | ||||||||||
| 1.7 | Free-water/cement ratio | Table 2, Fig 4 | ………0.52……………………………… X | ||||||||
| 1.8 | Maximum free-water/ | Specified | ……………………………………… | Use the lower value | |||||||
| ……// | 0.57 | ||||||||||
| cement ratio | |||||||||||
| 2 | 2.1 | Slump or Vebe time | Specified | SlumpX …………60-180……………………Xmm or Vebe timeX …………………XsX | |||||||
| 2.2 | Maximum aggregate size | Specified | …………20……XmmX | ||||||||
| 2.3 | Free-water content | Table 3 | ………………225…………………………………………… | 225 | kg/m3X | ||||||
| 3 | 3.1 | Cement content | C3 | …………225……… X÷X ……………0.52………………X= ……439.69…………Xkg/m3X | |||||||
| 3.2 | Maximum cement content | Specified | ……//……………Xkg/m3 | ||||||||
| 3.3 | Minimum cement content | Specified | …………………Xkg/m3 | ||||||||
| use 3.1 if ≤ 3.2 | |||||||||||
|
4439.69 |
|||||||||||
| use 3.3 if > 3.1 | |||||||||||
| 3.4 | Modified free-water/cement ratio | ………………//……………………………………………… | |||||||||
| 4 | 4.1 | Relative density of | ………………2.7………………………Xknown/assumed | ||||||||
| aggregate (SSD) | |||||||||||
| 4.2 | Concrete density | Fig 5 | X)X=X …2390………Xkg/m3X | ||||||||
| 4.3 | Total aggregate content | C4 | ………2390………… X–X ……439.69……… X–X ……225………X)X=X ………1725.31…Xkg/m3X | ||||||||
| 5 | 5.1 | Grading of fine aggregate | Percentage passing 600 µm sieveX ……30.7…………………………………………………………X%X | ||||||||
| 5.2 | Proportion of fine aggregate | Fig 6 | ……………………48…………………………………………………………X%X | ||||||||
| 5.3 | Fine aggregate content | …………………1725.31……… X×X…………0.48……………… X=X | 828.15 | Xkg/m3X | |||||||
| C5 | |||||||||||
| 5.4 | Coarse aggregate content | ……………1725.31…………… X–X …………828.15……………… X=X | 897.16 | Xkg/m3X | |||||||
| Cement | Water | Fine aggregate | Coarse aggregate (kg) | ||||||||
| Quantities per m3 | (kg)
439.69 |
(kg or litres)
225 |
(kg)
828.15 |
10 mm
|
20 mm
897.16 |
40 mm
|
|||||
Sample 3
| Concrete mix design form | Job title……………………………………… | ||||||||||
| Reference | |||||||||||
| Stage Item | or calculation | Values | |||||||||
| 1 | 1.1 | Characteristic strength | Specified | …25……………………………………XN/mm2 atX | ……28………………XdaysX | ||||||
| Proportion defectiveX ………………5………………………………………X%X | |||||||||||
| 1.2 | Standard deviation | Fig 3 | ………………………………………XN/mm2 or no dataX ……8……XN/mm2X | ||||||||
| 1.3 | Margin | C1 | (kX=X…………1.64…X)X ……………1.64…X×X …8…………X=X ……13.12……XN/mm2X | ||||||||
| or | X=X …………XN/mm2X | ||||||||||
| Specified | |||||||||||
| 1.4 | Target mean strength | C2 | XX …25……………X+X ………13.12…X=X ……38.12…XN/mm2X | ||||||||
| 1.5 | Cement strength class | Specified | 42.5 | ||||||||
| 1.6 | Aggregate type: coarse | Crushed | |||||||||
| Aggregate type: fine | Uncrushed | ||||||||||
| 1.7 | Free-water/cement ratio | Table 2, Fig 4 | ………0.52……………………………… X | ||||||||
| 1.8 | Maximum free-water/ | Specified | ……………………………………… | Use the lower value | |||||||
| ……// | 0.57 | ||||||||||
| cement ratio | |||||||||||
| 2 | 2.1 | Slump or Vebe time | Specified | SlumpX …………60-180……………………Xmm or Vebe timeX …………………XsX | |||||||
| 2.2 | Maximum aggregate size | Specified | …………20……XmmX | ||||||||
| 2.3 | Free-water content | Table 3 | ………………225…………………………………………… | 225 | kg/m3X | ||||||
| 3 | 3.1 | Cement content | C3 | …………225……… X÷X ……………0.52………………X= ……439.69…………Xkg/m3X | |||||||
| 3.2 | Maximum cement content | Specified | ……//……………Xkg/m3 | ||||||||
| 3.3 | Minimum cement content | Specified | …………………Xkg/m3 | ||||||||
| use 3.1 if ≤ 3.2 | |||||||||||
|
4439.69 |
|||||||||||
| use 3.3 if > 3.1 | |||||||||||
| 3.4 | Modified free-water/cement ratio | ………………//……………………………………………… | |||||||||
| 4 | 4.1 | Relative density of | ………………2.7………………………Xknown/assumed | ||||||||
| aggregate (SSD) | |||||||||||
| 4.2 | Concrete density | Fig 5 | X)X=X …2390………Xkg/m3X | ||||||||
| 4.3 | Total aggregate content | C4 | ………2390………… X–X ……439.69……… X–X ……225………X)X=X ………1725.31…Xkg/m3X | ||||||||
| 5 | 5.1 | Grading of fine aggregate | Percentage passing 600 µm sieveX ……29.15…………………………………………………………X%X | ||||||||
| 5.2 | Proportion of fine aggregate | Fig 6 | ……………………48…………………………………………………………X%X | ||||||||
| 5.3 | Fine aggregate content | …………………1725.31……… X×X…………0.48……………… X=X | 828.15 | Xkg/m3X | |||||||
| C5 | |||||||||||
| 5.4 | Coarse aggregate content | ……………1725.31…………… X–X …………828.15……………… X=X | 897.16 | Xkg/m3X | |||||||
| Cement | Water | Fine aggregate | Coarse aggregate (kg) | ||||||||
| Quantities per m3 | (kg)
439.69 |
(kg or litres)
225 |
(kg)
828.15 |
10 mm
|
20 mm
897.16 |
40 mm
|
|||||
Sample 4
| Concrete mix design form | Job title……………………………………… | ||||||||||
| Reference | |||||||||||
| Stage Item | or calculation | Values | |||||||||
| 1 | 1.1 | Characteristic strength | Specified | …25……………………………………XN/mm2 atX | ……28………………XdaysX | ||||||
| Proportion defectiveX ………………5………………………………………X%X | |||||||||||
| 1.2 | Standard deviation | Fig 3 | ………………………………………XN/mm2 or no dataX ……8……XN/mm2X | ||||||||
| 1.3 | Margin | C1 | (kX=X…………1.64…X)X ……………1.64…X×X …8…………X=X ……13.12……XN/mm2X | ||||||||
| or | X=X …………XN/mm2X | ||||||||||
| Specified | |||||||||||
| 1.4 | Target mean strength | C2 | XX …25……………X+X ………13.12…X=X ……38.12…XN/mm2X | ||||||||
| 1.5 | Cement strength class | Specified | 42.5 | ||||||||
| 1.6 | Aggregate type: coarse | Crushed | |||||||||
| Aggregate type: fine | Uncrushed | ||||||||||
| 1.7 | Free-water/cement ratio | Table 2, Fig 4 | ………0.52……………………………… X | ||||||||
| 1.8 | Maximum free-water/ | Specified | ……………………………………… | Use the lower value | |||||||
| ……// | 0.57 | ||||||||||
| cement ratio | |||||||||||
| 2 | 2.1 | Slump or Vebe time | Specified | SlumpX …………60-180……………………Xmm or Vebe timeX …………………XsX | |||||||
| 2.2 | Maximum aggregate size | Specified | …………20……XmmX | ||||||||
| 2.3 | Free-water content | Table 3 | ………………225…………………………………………… | 225 | kg/m3X | ||||||
| 3 | 3.1 | Cement content | C3 | …………225……… X÷X ……………0.52………………X= ……439.69…………Xkg/m3X | |||||||
| 3.2 | Maximum cement content | Specified | ……//……………Xkg/m3 | ||||||||
| 3.3 | Minimum cement content | Specified | …………………Xkg/m3 | ||||||||
| use 3.1 if ≤ 3.2 | |||||||||||
|
4439.69 |
|||||||||||
| use 3.3 if > 3.1 | |||||||||||
| 3.4 | Modified free-water/cement ratio | ………………//……………………………………………… | |||||||||
| 4 | 4.1 | Relative density of | ………………2.7………………………Xknown/assumed | ||||||||
| aggregate (SSD) | |||||||||||
| 4.2 | Concrete density | Fig 5 | X)X=X …2390………Xkg/m3X | ||||||||
| 4.3 | Total aggregate content | C4 | ………2390………… X–X ……439.69……… X–X ……225………X)X=X ………1725.31…Xkg/m3X | ||||||||
| 5 | 5.1 | Grading of fine aggregate | Percentage passing 600 µm sieveX ……63.03…………………………………………………………X%X | ||||||||
| 5.2 | Proportion of fine aggregate | Fig 6 | ……………………48…………………………………………………………X%X | ||||||||
| 5.3 | Fine aggregate content | …………………1725.31……… X×X…………0.48……………… X=X | 828.15 | Xkg/m3X | |||||||
| C5 | |||||||||||
| 5.4 | Coarse aggregate content | ……………1725.31…………… X–X …………828.15……………… X=X | 897.16 | Xkg/m3X | |||||||
| Cement | Water | Fine aggregate | Coarse aggregate (kg) | ||||||||
| Quantities per m3 | (kg)
439.69 |
(kg or litres)
225 |
(kg)
828.15 |
10 mm
|
20 mm
897.16 |
40 mm
|
|||||
4.5 Tests on fresh concrete
4.5.1 Slump test
Table 5showing values for slump test
| Sample number | Source | Slump (mm) | Workability classification |
| 1 | Ekalala | 85 | Very high |
| 2 | Ekalala | 90 | Very high |
| 3 | Tambiti | 100 | Very high |
| 4 | Athi River | 110 | Very high |
4.6 Tests on hardened concrete
4.6.1 Compressive strength test
After 7 days
Sample 1- 9.045Mpa
Sample 2 -7.303Mpa
Sample 3 -12.741Mpa
Sample 4- 15.518Mpa
After 28 days
Sample 1- 17.781Mpa
Sample 2 -15.489Mpa
Sample 3 -25.818Mpa
Sample 4- 24.898Mpa
CHAPTER FIVE: ANALYSIS
5.1 Comparison of material properties of sand with recommended values
5.1.1 Specific gravity
Results showed that the average apparent specific gravity was 2.27 and that of bulk specific gravity was 2.18 while the average water absorption of dry mass was 4.22 .This is well below the expected specific gravity values of 2.6 for sand used for concrete production, implying that the sand used in this research is not the recommended one used for building.
Bulk specific gravity was used for the calculation of volume occupied by sand in concrete
5.1.2 Grading
Summary of sieve analysis and geological grading zone classification are indicated in the appendix section
Sieve size 600 microns was used to determine the degree of fineness in sand. 3 out of 4 of the samples had above 50% passing the 600 microns sieve size. Majority of the samples (75%) were within zone 3, implying fine sand. Sample 4 was in zone 2, implying normal sand. Fine sand necessitates the adjustment of the mix design proportions to ensure that concrete quality is not affected.
Sample 4 had the highest finest modulus of 3.94, implying that it contains coarser particles than the others (sample1 F.M=3.07 Sample2 F.M= 3.20 Sample 3 F.M= 2.69) Sample 3 has the lowest fineness modulus implying that it contains the finest particles.
IS 383 recommends sands of zones 1 to zone 3 to be used for structural concrete works. Using this code, all of the three samples are suitable. AASTHO M6-93 specifies that the fineness modulus of sand shall not be less than 2.3 and not more than 3.1. Sample 3, with a fineness modulus of 2.69 and sample 1, with an F.M of 3.07 meets this criteria. The other two samples all fail to meet this standard according to AASTHO. ASTM C33-93 uses the same criteria for rejection or acceptance of sand based on its fineness modulus as AASTHO. Therefore, all four samples, except sample 1 and 3 still fail. U.S.B.R specifies the limits of 2.50 and 3.0 for fineness modulus. The four samples, except sample 3, all fail. The summary of this is indicated in the appendix section
5.1.4 Silt and clay content
| BS 882 (1989) AND IS (1970) (4%) |
| ASTM C117 (1995) (10%) |
Figure 9 showing silt and clay content
BS 882 (1989) and IS (1970) recommends fine aggregates be used in concrete production should contain no more than a maximum of 4% silt and clay content. None of the samples met this limit. Only sample 4 came close. Comparatively, the ASTM C117 (1995) allows 10% by weight of silt and clay content in sand used for concrete production. Samples 2 and 4 met this standard
5.1 Regression Analysis
5.1.1 Correlation between Silt and clay content and Fineness Modulus and Compressive strength
At 7 days
A regression equation for predicting compressive strength of concrete at 7 days made from sand containing varying levels of silt and clay content and fineness modulus was found to be
| 12 |
Or
| 13 |
With R2 =0.672930118
Where
Fcu7 = Compressive strength of concrete at 7 days
SCI- Silt and Clay content in sand (%)
FM= Fineness Modulus of Sand
The output from the regression and correlation analysis showing the relationship between silt and Clay content and Fineness Modulus against Compressive strength at 7 days is shown in the tables in the appendix.
From the R2 value, it is deduced that the contribution of the silt and clay content and Fineness Modulus to the compressive strength of concrete at 7 days is 67% which is very significant. What this analysis shows is that although there are other factors contributing towards strength, silt and clay content and Fineness Modulus play a major role.
From the table below, it is deduced that the contribution of silt and clay content towards compressive strength at 7 days is 21% while that of Fineness Modulus is 46%.
It is deduced that the contribution of Fineness Modulus towards compressive strength is higher that of Silt and Clay content. Therefore, the greater the number of fines, the greater the reduction in strength at 7 days.
The 67% contribution from Silt and Clay content and Fineness Modulus represents a 16.75N/mm2 contribution for concrete with target strength of 25N/mm2.
At 28 days
A regression equation for predicting compressive strength of concrete at 28 days made from sand containing varying levels of silt and clay content and fineness modulus was found to be
| 14 |
Or
| 15 |
Where
Fcu28 = Compressive strength of concrete at 28 days
SCI- Silt and Clay content in sand (%)
FM= Fineness Modulus of Sand
The output from the regression and correlation analysis showing the relationship between silt and Clay content and Fineness Modulus against Compressive strength at 28 days is shown in the
It is seen that the R2 value is now 0.5088 and this means that the two properties collectively contribute to a 50.88% variation in compressive strength at 28 days. This is a reduction from the 67.29% contribution at 7 days. To show the correlation between the variables, a correlation analysis was done with the results shown in the appendix section.
The correlation of both the sand properties is positive, implying that an increase in either of them would increase the Compressive strength. While Silt and Clay content contributes to 13.8%, Fineness Modulus contributes to 10.4%.
5.1.2 Correlation between Specific gravity and water absorption and compressive strength
At 7 days
A regression equation for predicting the compressive strength of sand at 7 days containing varying levels of specific gravity and water absorption properties is
| 16 |
Or
| 17 |
Where
SG= specific gravity of sand
WA= water absorption of sand
Fcu7= compressive strength at 7 days
The output from the regression and correlation analysis showing the relationship between specific gravity and water absorption against Compressive strength at 7 days is shown in the tables below
The R2 of value 0.209 means that these two properties contribute to 20.9% of the compressive strength of concrete after 7 days.
To show the correlation between the two properties, a correlation analysis was done with these results.
Specific gravity contributes to 21% of the compressive strength alteration while Water absorption contributes to 42% of it. This implies a 5.25% reduction in target strength of 25%, brought about by specific gravity.
At 28 days
A regression equation for predicting the compressive strength of sand at 7 days containing varying levels of specific gravity and water absorption properties is
| 18 |
Or
| 19 |
Where
SG= specific gravity of sand
WA= water absorption of sand
Fcu28= compressive strength at 28 days
The analysis of the output from the regression and correlation analysis showing the relationship between specific gravity and water absorption against Compressive strength at 28 days is shown below.
The R2 value of 0.46499 means that Specific Gravity and water Absorption contribute to 46.499% of the compressive strength at 28 days.
There is now a positive correlation between Specific Gravity and Compressive Strength is now positive and of 14.8% while that of Water Absorption is 44.1%. This implies a 3.7 Mpa influence in cement with at target strength of 25Mpa at 28 days.
5.1.3 Correlation between Silt and clay content, Fineness Modulus, Specific gravity, and compressive strength
At 7 days
A regression analysis was done to compare the effects of the four properties tested.
| 20 |
Or
| 21 |
Where
Fcu7= Compressive strength after 7 days
SC= silt and clay content in %
FM= Fineness Modulus
SG= Specific Gravity
The output from the regression and correlation analysis showing the relationship between silt and clay content, Fineness Modulus and specific gravity against Compressive strength at 7 days is shown in the tables below.
The value of 1 for R2 indicates perfect fit. All the variance in compressive strength at 7 days has been explained.
A standard error of 0 means that the statistic has no random error. This means that a regression analysis of the three main properties gives a better explanation of the variation in compressive strength than one involving only one set of two variables.
To show the effects of each variable compared to the other, a correlation analysis was done as shown in the table below.
The correlation values of Silt and Clay content and Specific Gravity are negative. This means that they have an inverse relationship with Compressive strength at 7 days. They each contribute to 21.02% and 11.98% of the compressive strength respectively. Fineness Modulus contributes to 46.49% of it. This totals to 79.47%. The remaining 20.53% is affected by other properties that were not varied in this study; Cement type, Coarse aggregate properties, water properties and workmanship.
At 28 days
A regression analysis was done to compare the effects of the four properties tested.
| 22 |
Or
| 23 |
Where
Fcu28= Compressive strength after 28 days
SC= silt and clay content in %
FM= Fineness Modulus
SG= Specific Gravity
The output from the regression and correlation analysis showing the relationship between silt and clay content, Fineness Modulus and specific gravity against Compressive strength at 28 days is shown in the tables below.
The value of R2 is 1 and this is deduced to mean that all the variance in compressive strength has been explained by the three variables.
It is seen that the standard error is again 0 and this means that an equation involving the three variables better accounts for the variation in compressive strength at 28 days that any one equation involving only one or two of the variables. A correlation analysis further shows the influence of each variable in the Compressive strength at 28 days.
Following the trend as before, there is a positive correlation on each of the variables. The variables (Silt and Clay content, Fineness Modulus and Specific Gravity) contribute to 13.88%, 10.49% and 14.8% respectively of the compressive strength at 28 days. This is a drop from the 21%, 46% and 11.9% contribution at 7 days. At 28 days, the three properties contribute to only 39.17% of the compressive strength. This implies that the significance of other variables (workmanship. Coarse aggregate properties, cement properties and curing conditions) increases with time.
CHAPTER SIX: DISCUSSION OF RESULTS
6.1 Specific Gravity
The specific gravity of the four samples is 2.26, 2.1, 2.26 and 2.09 respectively. All the samples have a higher value than the 2.6 required for concrete mix in accordance with ASTM C127. The water absorption values of 2.34%, 6.14%, 6.14% and 6.4% are greater than the maximum accepted limit of 2.3% according to ASTM C127. A high value of water absorption increases the amount of water needed to make a workable concrete mix. (Kiambigi Maina, 2018) The bulk specific gravity has been used in the calculation of volume of aggregates in the concrete mix.
Concerning its effect on the compressive strength of concrete, it had a negative correlation of 0.1198 at 7 days and a positive correlation of 0.1483 at 28 days. This implies that a high bulk specific gravity would retard the early gain of strength but would contribute to strength at a later stage.
6.2 Grading
6.2.1Fineness Modulus
Fineness Modulus is a measure of aggregate fineness and is helpful in evaluating fine aggregate proportions in concrete mixtures. From the study, the values of Fineness Modulus for the four sand samples were 3.07, 3.20, 2.69 and 2.09 respectively. With the grading zones being Ⅲ, Ⅲ, Ⅲ and Ⅱ respectively
Comparing these values with the codes stipulations;
AASHTO designation M6-93 “Standard specification for fine aggregate for Portland cement” stipulates that the value of Fineness Modulus should not be less than 2.3 and not more than 3.1
IS 383 “Specification for coarse and Fine aggregates from natural sources for concrete” recommends that the use of sand from Zone Ⅰ to Ⅲ for structural works.
ASTM Designation C33-93 “Standard specifications for concrete aggregates” stipulates that the fine aggregates shall have not more than 45% passing any sieve size and retained on the next consecutive sieve and its Fineness Modulus will not be less than 2.3 and not more than 3.1
USBR specifies that the Fineness Modulus of Sand shall not be less than 2.5 and not more than 3.0.
The results show that all the samples conformed to the IS383 code. However, only samples 1 and 3 conformed to both AASHTO and ASTM codes. Sample 3 was also the only one conforming to USBR code stipulations.
It is seen that only one out of the four samples was within the range recommended in all the codes considered (sample 3).
The regression analysis at 7 days shows that Fineness Modulus has a 0.4649 correlation with Compressive strength after both 7 and 28 days. This means that a higher F.M value would result in an increase in compressive strength of concrete. However, as this accounts for only 46.49% of the compressive strength variation, a higher F.M value might mean less compressive strength in concrete depending on the combination of other factors. A higher F.M value means that the aggregate is now coarser and the concrete mix will need more water to be workable owing to the fact that more aggregates will be needed. (Kiambigi Maina, 2018)
6.3 Silt and Clay content
Silt and Clay content, together with Organic impurities, are some of the deleterious substances that can be found in fine aggregates. The codes; ASTM C117 (1995), BS 882 (1989) AND IS (1970) recommend maximum values of 10%, 4% and 4% respectively. The results of the four samples showed that they had values of 14.29%, 9.09%, 18.18% and 5.26% for samples 1, 2, 3, and 4 respectively. Judging by the results, only samples 4 and 2 contain the recommended amount according to ASTM C117 (1995). 100% of the samples fail according to BS (882) and IS (1970).
Silt and clay content has the effect of lowering the compressive strength of concrete, according to (Tauseef Bashir, 2018).
Our results show a negative correlation between the percentage value of Silt and Clay content and compressive strength at 7 days of -0.2102. However this correlation reduces to 0.1388 for a 28 day test. This shows that the effect of deleterious substances reduces with time.
6.4 Regression equations
A number of regression equations for predicting the value of compressive strength of concrete made using sand containing varying values of; silt and clay content, Specific gravity, Fineness Modulus and Water absorption were developed.
7 day strength
Equation 13 (R2 =0.673 and a standard error of 3.655)
Equation 17 (R2 =0.209 and a standard error of 5.684)
Equation 21 (R2= 1 and a standard error of 0)
28 day strength
Equation 15 (R2= 0.5088 and a standard error of 6.234)
Equation 19 (R2 =0.465 and a standard error of 6.507)
Equation 23 (R2= 1 and a standard error of 0)
Where
Fcu28= Compressive strength of concrete cubes cured for 28 days
Fcu7= Compressive strength of concrete cubes cured for 7 days
SC= silt and clay content in %
FM= Fineness Modulus of fine aggregate
SG= Bulk Specific Gravity of fine aggregate
WA= water absorption of fine aggregate
As seen from the values of standard error and R2, the two equations best suited for predicting compressive strength are the ones involving the three variables of Silt and Clay content, Fineness Modulus and Specific Gravity. The other equations have an R2 value of less than 1 and this means that they do not fully explain the variation in compressive strength.
CHAPTER SIX: CONCLUSION
This chapter presents the conclusions drawn from this research
These findings should prove helpful to developers, the academic fraternity, government institutions and other stakeholders in the construction industry. It is concluded that;
- Most of the building sand being sold in Juja fails to meet requirements for Silt and Clay content, Specific gravity, Fineness Modulus and Water absorption. 100% of the samples considered failed to meet both the specific gravity and water absorption requirements of ASTM C127. This was also the case concerning Silt and Clay content according to both BS882 and IS 1970. The silt and clay contents were all greater than the minimum of 4%. On the other hand, 50% of the samples considered passed the Fineness Modulus requirements in accordance with AASTHO M6-93 and ASTM C33-93.
- High values of silt and clay content and specific gravity prevent the rapid gain in strength at an early age. However, they positively contribute to strength at a later age.
- The influence of fine aggregate properties on compressive strength of concrete reduces with age.
- Fineness Modulus of fine aggregate is the greatest contributor to a variation in compressive strength of concrete at 7 days compared with silt and clay content, specific gravity and water absorption.
- All of the four samples failed in compressive strength at 7 days with only sample 3 achieving the target strength at 25 days.
- Sand from Tambiti is best suited for building compared with that from Ekalala and Athi River.
- Other factors such as properties of coarse aggregates, water and cement contribute to the compressive strength of concrete. They should be taken into account as they will also compromise the compressive strength and reduce the structural integrity of buildings.
CHAPTER SEVEN: RECCOMENDATION
Judging from the research, we recommend the following;
- There needs to be policies focused on
- Monitoring and surveillance of the quality of sand in construction sites and at vendors in Juja. Moreover, entry points of sand, prior to delivery to vendors and construction sites need to be thoroughly vetted. This would prevent the entry, sale and use of inferior sand,
- All stakeholders in the construction industry need to be held accountable for the quality of construction materials in use at sites. This starts from the harvesters, vendors, contractors and engineers approving the use of such ineffective materials.
- Fine aggregate properties; silts and clay content, specific gravity and Fineness Modulus should be tested before sand is used at any site and checked that it conforms to the standards in application. These properties should be included as variables in the calculation of a concrete mix.
RECOMMENDED AREAS FOR FURTHER RESEARCH
This is by no means an exhaustive research project. Inadequate laboratory facilities, particularly regarding the availability of equipment, limited the number of tests that could be done. Furthermore, constraints on time and resources reduced the number of samples that could reasonably be collected and analyzed. Therefore, there are gaps in the existing knowledge that this study has not sufficiently filled. We thus recommend that;
- Further experimental research on the chemical properties of fine aggregates and their correlation with compressive strength of concrete.
- The use of more than 40 sand samples to ensure as close to the representation of all sand types and sand mixes in use within Juja.
- It was observed that the influence of fine aggregate properties reduces with time. Owing to the fact that this study did not monitor concrete properties past 28 days, it is recommended that concrete be tested after 56 days. Such a correlation analysis would reveal how significant the properties of fine aggregates are in a building that is already in use.
- A more extensive study that includes variation in coarse aggregate properties.
APPENDIX
APPENDIX A
Table 6 showing a summary of building collapses in recent years
| Location | Building description | Date | No of reported deaths | No injured | Suspected causes |
| Ronald Ngara Street, Nairobi CBD | Five storey commercial building | 24th June 2006 | 20 | 35 | Inadequate curing |
| Kiambu town | Three storey commercial building | 19th October 2009 | 11 | 14 | Structural failure and materials |
| Kiambu town | Rental residential building | January 2010 | 3 | 4 | Heavy downpour |
| Mlolongo Nairobi | Six storey building | 9th June 2012 | 4 | 15 | Substandard materials, inappropriate foundation design for water logged area |
| Matigari building along Thika road near Mathare North | Not reported | 9th September 2011 | Not reported | Not reported | Poor workmanship and poor materials |
| Kasarani, Nairobi | Residential buildings | 5th February 2012 | none | 6 | Large spans between the beams and columns, use of substandard materials |
| Luanda, Vihiga | Three storey building | September 2011 | 3 | 5 | Heavy rains and use of poor concrete mix |
| Langata, southern bypass Nairobi | Not reported | 20th June 2011 | None | 6 | Use of poor quality sand for beams and columns |
| Mosocho in Kisii county | One storey building | 7th May 2012 | none | 3 | Heavy rains, cheap and poor quality materials |
| Western City of Kisumu | Multiple Storeyed building | 2013 | 9 | ||
| Makongeni, Nairobi | Five Storey building | December 17th 2014 | 1 | 7 | |
| Huruma, Nairobi | Six Storey residential building | January 4th 2015 | 5 | Several | |
| Mwemba Estatee, Kisii County | Four Storey building |
APPENDIX B: AGGREGATE PROPERTIES
FINE AGGREGATE
Table 7showing coefficient of uniformity and curvature for sample 1
| coefficient of uniformity | 3.108063 |
| Coefficient of curvature | 1.297384 |
| Sample number | Name of supply point as indicated by supplier | Silt and Clay content (%) |
| 1 | Ekalala | 14.29 |
| 2 | Ekalala | 9.09 |
| 3 | Tambiti | 18.18 |
| 4 | Tana River | 5.26 |
Table 8 showing summary of sieve analysis and geological grading zones
| Grading Zone | Description |
| Zone Ⅰ | Coarse Sand |
| Zone Ⅱ | Normal Sand |
| Zone Ⅲ | Fine sand |
| Zone Ⅳ | Very fine sand |
Table 9 Showing specific gravity results
| Source of sand sample (as per supplier) | Ekalala | Ekalala | Tambiti | Tana River |
| Sample No. | 1 | 2 | 3 | 4 |
| Weight of saturated and surface dry sample (g) S | 500 | 500 | 500 | 500 |
| Weight of bottle + sample + water (g) C | 1587 | 1579 | 1587 | 1579 |
| Weight of bottle + water (g) B | 1303 | 1303 | 1303 | 1302 |
| Weight of oven dried sample (g) A | 488.3 | 469.3 | 490 | 468 |
| Bulk Specific gravity (oven dried) A/(B+S-C) | 2.26 | 2.10 | 2.26 | 2.09 |
| Specific gravity (saturated and surface dry) S/(B+S-C) | 2.31 | 2.23 | 2.31 | 2.24 |
| Apparent specific gravity A/(B+A-C) | 2.39 | 2.53 | 2.37 | 2.45 |
| Water absorption of dry mass (%) ((S-A)/S)*100 | 2.34 | 6.14 | 2.00 | 6.4 |
Figure 10 showing silt and clay content of the four samples
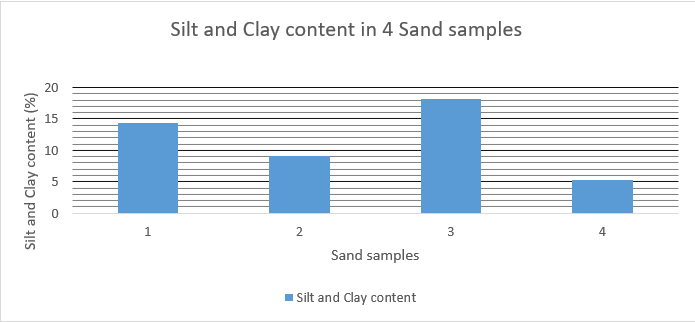
Table 10 showing summary of sieve analysis and geological grading zone classification
| Sieve Size | 10 | 5 | 2.36 | 1.25 | 0.6 | 0.3 | 0.18 | 0.075 | % Passing 600 microns | Grading zone classification | Fineness modulus |
| Sample number | % passing their respective standard sieve sizes | ||||||||||
| 1 | 99.88 | 99.16 | 96.83 | 89.95 | 70.84 | 23.04 | 10.90 | 1.68 | 70.84 | Ⅲ | 3.07 |
| 2 | 99.47 | 97.95 | 93.91 | 87.42 | 69.99 | 20.69 | 8.40 | 1.35 | 69.99 | Ⅲ | 3.20 |
| 3 | 99.91 | 99.82 | 99.25 | 89.93 | 70.84 | 41.44 | 24.07 | 5.25 | 70.84 | Ⅲ | 2.69 |
| 4 | 98.18 | 95.79 | 90.28 | 73.69 | 36.97 | 7.47 | 2.73 | 0.46 | 36.97 | Ⅱ | 3.94 |
| Sample | 1 | 2 | 3 | 4 |
| Source | Ekalala | Ekalala | Tambiti | Tana River |
| Fineness Modulus | 3.07 | 3.20 | 2.69 | 3.94 |
| Grading Zone | Ⅲ | Ⅲ | Ⅲ | Ⅱ |
| Code (Specification) | IS 383( Zone Ⅰ to Ⅲ ) | |||
| Conformation to code | √ | √ | √ | √ |
| Code (Specification) | AASTHO M6-93
(2.3<F.M<3.1) |
|||
| Conformation to code | √ | X | √ | X |
| Code (Specification) | ASTM C33-93
(2.3<F.M<3.1) |
|||
| Conformation to code | √ | X | √ | X |
| Code (Specification) | U.S.B.R
(2.50<F.M<3.0) |
|||
| Conformation to code | X | X | √ | X |
Figure 11 showing analysis of Fineness Modulus and Geological grading zones according to codes
COARSE AGGREGATES
Coarse aggregate (2000g)
Particle density on an oven-dried basis (g/m3)
= = 2.44
Particle density on a saturated and surface dried basis (g/m3)
= = 2.52
Apparent Particle density (g/m3)
= = 2.66
Water absorption (%)
× 100% = = 3.34%
APPENDIX C: REGRESSION AND CORRELATION ANALYSIS
Table 11 showing a summary of compressive strength data for regression analysis
| Sample number | Source | Compressive strength data (MPa) | Silt and Clay content | Fineness Modulus | Specific gravity | Water Absorption | Grading | |
| At 7 days | At 28 days | |||||||
| 1 | Ekalala | 9.045 | 17.781 | 14.29 | 3.07 | 2.26 | 2.34 | Ⅲ |
| 2 | Ekalala | 7.303 | 15.489 | 9.09 | 3.20 | 2.10 | 6.14 | Ⅲ |
| 3 | Tambiti | 12.741 | 25.818 | 18.18 | 2.69 | 2.26 | 6.14 | Ⅲ |
| 4 | Athi River | 15.518 | 19.397 | 5.26 | 3.94 | 2.09 | 6.4 | Ⅱ |
CORRELATION ANALYSIS
Table 12 showing correlation analysis results between 28 day compressive strength, fineness Modulus and specific gravity
| At 28 days | Silt and Clay content | Fineness Modulus | Specific gravity | |
| At 28 days | 1 | |||
| Silt and Clay content | 0.138844855 | 1 | ||
| Fineness Modulus | 0.104903651 | -0.941584818 | 1 | |
| Specific gravity | 0.148342286 | 0.930909726 | -0.785014954 | 1 |
Table 13 showing correlation between 7 day compressive strength, silt and clay content, fineness modulus and specific gravity
| At 7 days | Silt and Clay content | Fineness Modulus | Specific gravity | |
| At 7 days | 1 | |||
| Silt and Clay content | -0.210238263 | 1 | ||
| Fineness Modulus | 0.464995201 | -0.941584818 | 1 | |
| Specific gravity | -0.119820334 | 0.930909726 | -0.785014954 | 1 |
Table 14 showing correlation analysis results between 28 day compressive strength, specific gravity and water absorption
| At 28 days | Specific gravity | Water Absorption | |
| At 28 days | 1 | ||
| Specific gravity | 0.148342286 | 1 | |
| Water Absorption | 0.441060629 | -0.603684378 | 1 |
Table 15 showing correlation analysis results between 7 day compressive strength, specific gravity and water absorption
| At 7 days | Specific gravity | Water Absorption | |
| At 7 days | 1 | ||
| Specific gravity | -0.119820334 | 1 | |
| Water Absorption | 0.424100649 | -0.603684378 | 1 |
Table 16 showing correlation analysis results between 28 day compressive strength, silt and clay content and fineness modulus
| At 28 days | Silt and Clay content | Fineness Modulus | |
| At 28 days | 1 | ||
| Silt and Clay content | 0.138844855 | 1 | |
| Fineness Modulus | 0.104903651 | -0.941584818 | 1 |
Table 17 showing correlation analysis results for silt and clay content and fineness modulus and 7 day compressive strength
| At 7 days | Silt and Clay content | Fineness Modulus | |
| At 7 days | 1 | ||
| Silt and Clay content | -0.210238263 | 1 | |
| Fineness Modulus | 0.464995201 | -0.941584818 | 1 |
REGRESSION ANALYSIS
Table 18 showing regression statistics for day 7 for silt and clay content and fineness modulus.
| Regression Statistics | |
| Multiple R | 0.820323179 |
| R Square | 0.672930118 |
| Adjusted R Square | 0.018790354 |
| Standard Error | 3.654846442 |
Table 19 showing regression statistics for silt and clay content and fineness modulus at 7 days
| DAY 7 REGRESSION | Coefficients | Standard Error | t Stat | P-value |
| Intercept | -57.60941156 | 50.96440223 | -1.13039 | 0.461085698 |
| Silt and Clay content | 1.302199723 | 1.101990408 | 1.18168 | 0.447107428 |
| Fineness Modulus | 16.59501203 | 11.96921754 | 1.386474 | 0.397790834 |
Table 20 showing regression statistics at 28 days for Silt and Clay content and fineness Modulus
| Regression Statistics | |
| Multiple R | 0.713330409 |
| R Square | 0.508840273 |
| Adjusted R Square | -0.473479181 |
| Standard Error | 6.234633617 |
| Observations | 4 |
Table 21 showing regression coefficients at 28 days for silt and clay content and fineness Modulus
| Coefficients | Standard Error | t Stat | P-value | |
| Intercept | -66.89602619 | 86.93781817 | -0.769469807 | 0.582475606 |
| Silt and Clay content | 1.892566602 | 1.879834503 | 1.006772989 | 0.497851375 |
| Fineness Modulus | 20.3845067 | 20.41773498 | 0.998372578 | 0.500518446 |
Table 22 showing regression statistics at 7 days for specific gravity and water absorption
| Regression Statistics | |
| Multiple R | 0.457219629 |
| R Square | 0.209049789 |
| Adjusted R Square | -1.372850632 |
| Standard Error | 5.683599018 |
Table 23 showing regression coefficients at 7 days for specific gravity and water absorption
| Coefficients | Standard Error | t Stat | P-value | |
| Intercept | -12.41663657 | 101.1325716 | -0.122775841 | 0.922227691 |
| Specific gravity | 8.292620562 | 43.16790835 | 0.192101514 | 0.87917628 |
| Water Absorption | 1.048754575 | 2.113846319 | 0.496135677 | 0.706803889 |
Table 24 showing regression statistics at 28 days for specific gravity and water absorption
| Regression Statistics | |
| Multiple R | 0.681906501 |
| R Square | 0.464996476 |
| Adjusted R Square | -0.605010571 |
| Standard Error | 6.506956202 |
| Observations | 4 |
Table 25 showing regression coefficients at 28 days for specific gravity and water absorption
| Coefficients | Standard Error | t Stat | P-value | |
| Intercept | -67.09112637 | 115.7831881 | -0.57945482 | 0.665662733 |
| Specific gravity | 35.13907005 | 49.42144723 | 0.71100852 | 0.606520543 |
| Water Absorption | 2.202150589 | 2.420069637 | 0.909953398 | 0.529991847 |
Table 26 showing regression statistics at 7 days for Silt and Clay content, Fineness Modulus and Specific gravity
| Regression Statistics | |
| Multiple R | 1 |
| R Square | 1 |
| Adjusted R Square | 65535 |
| Standard Error | 0 |
| Observations | 4 |
Table 27 showing regression coefficients at 7 days for Silt and Clay content, Fineness Modulus and Specific gravity
| Coefficients | Standard Error | t Stat | |
| Intercept | 66.76688657 | 0 | 65535 |
| Silt and Clay content | 3.873082111 | 0 | 65535 |
| Fineness Modulus | 29.92181424 | 0 | 65535 |
| Specific gravity | -90.67619454 | 0 | 65535 |
Table 28 showing regression statistics at 28 days for Silt and clay content, Fineness Modulus and Specific gravity
| Regression Statistics | |
| Multiple R | 1 |
| R Square | 1 |
| Adjusted R Square | 65535 |
| Standard Error | 0 |
| Observations | 4 |
Table 29 showing regression coefficients at 28 days for Silt and clay content, Fineness Modulus and Specific gravity
| Coefficients | Standard Error | t Stat | |
| Intercept | 145.2717521 | 0 | 65535 |
| Silt and Clay content | 6.278116041 | 0 | 65535 |
| Fineness Modulus | 43.11808263 | 0 | 65535 |
| Specific gravity | -154.6803292 | 0 | 65535 |
APPENDIX E BUDGET
| Item | Cost |
| Cement(OPC) | 1700 |
| Sand | 1800 |
| Coarse Aggregates | 900 |
| Transport | 2300 |
| Internet Charges | 1500 |
| Printing | 1500 |
| Material Testing | 3000 |
| Total | 12700 |