


Solution For Inadequacy Of Shuttle Stops For Students at University of Buffalo
INTRODUCTION
The study was conducted in University of Buffalo to assess whether it would be feasible to increase the size or number of shuttle stops at school or reduce the time between arrivals of shuttles taking students to the school. At the moment, the time taken by shuttles from the dorms to school is 5 minutes, with the shuttles being available every 20 minutes. However, it comes to light that the shuttle stop sizes and number are insufficient during the cold, rainy or snowy periods as few students can fit inside to be sheltered from the elements while waiting for the shuttles.
Currently, the shuttle stops are near all campus residence halls and apartment complexes. The school also offers parking locations and bike storage on buses. The campus shuttles seat between 20 and 28 people and operate from 6:30AM to 11:30PM. There are also on-demand shuttles. There are three off-campus student housings; University village at Sweet home, Villas at Chestnut Ridge and Villas on Rensch. (Communities, n.d.) The temperatures in Buffalo can drop to as low as 17.8oF (Average Weather in Buffalo, n.d.) and this cold can have severe health effects to students standing outside unsheltered while waiting for the shuttle. These range from mild effects like sedentary behavior and dry skin and mucus membranes to more life threatening ones like frostbite, hypothermia and an increased risk of heart problems. With the rising cost of medical care in the United States, it is vital that we put in efforts to protect students during the harsh winter.
I will focus my research on these key tasks.
- Determine the level of student concern for the inadequacy of shuttle stops during winter.
- Compare the advantages of building new shuttle stops or increasing their capacity versus buying new additional buses.
- Determine possible locations of new shuttle stops
- Determine the effect of increasing shuttle bus frequency.
A survey was sent to students through Google Forms. This was to determine how much they are affected by the waiting times in insufficient shuttle stops during winter. In the survey, the level of negative impact was ranked on a scale of 1 to 10. About 70% of students using bus and shuttle services claimed to experience a level 9 impacts during winter.
Various car dealerships were contacted to find out the prices of new shuttle buses. They ranged from $7,000 to $10,000. Meanwhile, the cost of building a shuttle stop ranges from $10,000 to $12,000. However, adding more buses would not increase the capacity of the service. It will only lead to longer queues of buses waiting at the terminals for full loads.
A study of the North and South Campus Parking maps convinces me that the best locations of new stops should be next to the existing ones. This is so that the familiarity of both students and drivers with the current layout of stops isn’t interfered with.
(Hemingson, 2017) Reviewed trends in transit ridership in Texas in 2015 and 2016, focusing on Capital Metro. An increase in the frequency of buses on a number of sets of routes saw and increase in bus ridership. This is echoed by (Brechan, 2017) who concluded that increasing frequencies would generate more journeys. Reducing the time between buses would mean that the shuttle stops are emptied before they exceed their capacity and students will not have to wait outside.
I recommend that the time between shuttles to be dynamic. It should steadily be reduced during winter up to a point when the number of shuttles is the limiting factor, after which the option to build more stops will be considered if there is still overcrowding in the existing stops.
In the proceeding sections, I will discuss my methodology, results, conclusions and recommendations.
METHODOLOGY
In order to recommend a solution to the problems facing students when waiting in the cold for shuttles, the following tasks have to be completed.
- Determine the level of student concern with inadequacy of shuttle stops
- Research into the merits and demerits of buying new shuttles buses versus building more stops.
- Survey the campus for locations of new shuttle stops.
- Research into the effectiveness of increasing the frequency of shuttle operations.
Task 1 Determine the level of student concern with inadequacy of shuttle stops
In order to ascertain how much the students at UB are affected during winter, I surveyed them through a Google Forums Survey. The survey gathered data from students using shuttle services regularly. The question asked was how much they are affected by the waiting times and the inadequacy of stops to accommodate them during winter months. This was ranked on a scale of 1 to 10. This was done to ease the analysis of data. There was also an optional question asking for suggestions from the students on what step should be taken to tackle this problem.
Task 2 Research into the merits and demerits of buying new shuttles buses versus building more stops
This was completed by researching the websites of several car dealerships and transport companies to find and estimate of the price of buying shuttles and building stops. Research papers focusing on the impact of increased fleets to a transport service were also studied. This was done because of the impracticality of conducting a full research on campus and the fact that market prices during construction of the existing shuttle stops might have fluctuated and thus are incomparable with the current ones.
Task 3 Survey the campus for locations of new shuttle stops
The North and South Campus Parking maps were studied. They show the locations of stops and the routes taken by shuttles at UB. They enabled me to accurately suggest the possible locations of new stops such that they are still along the routes currently taken.
Task 4 Research into the effectiveness of increasing the frequency of shuttle operations
I will review a number of research papers that relate bus frequency and transportation level of service. It will be beneficial to choose studies that are as close to the transportation environment in UB as possible. This information will be used to estimate what the optimal bus frequency could be to prevent overcrowding at stops.
RESULTS
This section has detailed description of the results of methods mentioned in the previous chapter.
Task 1 Determine the level of student concern with inadequacy of shuttle stops
The survey was meant only for students using shuttles to travel. A total of 58 students took it.
How much they are affected by long waiting times in the winter because of inadequate space in shuttle stops.
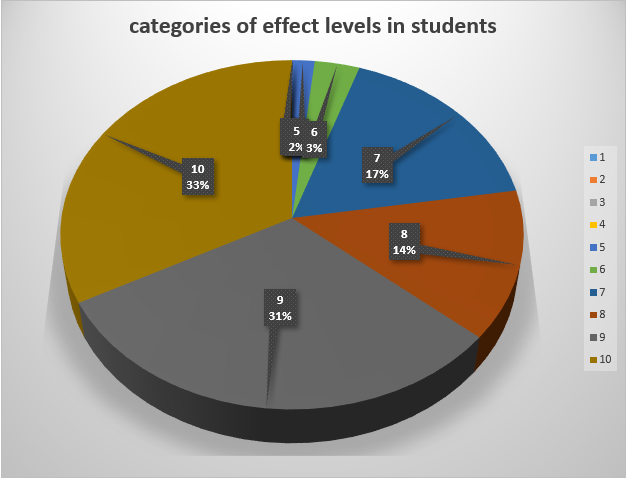
Figure 1 how much students are affected by waiting times because of insufficient stops capacities
The majority of students rated their negative experience as a level 9 or 10
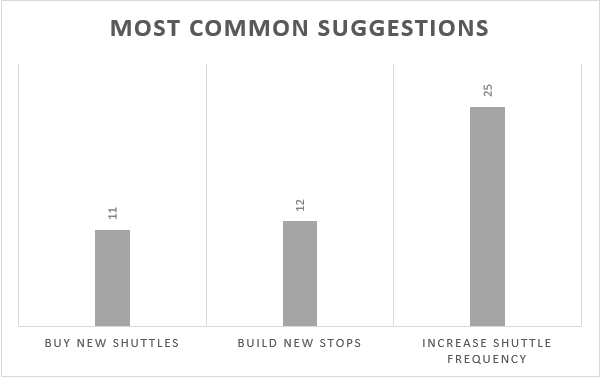
Optional descriptive question on steps that should be taken
Task 2 Research into the merits and demerits of buying new shuttles buses versus building more stops
The cost of a few shuttles according to (shuttle buses for sale, 2020) are as follows
| Model | Year | Number of passengers | Prices |
| Ford Starcraft Starquest- S68877 | 2019 | 14 | $55900 |
| Ford Starcraft Starlite- S67298 | 2019 | 8+2 Wheelchairs | $55999 |
| Ford Starcraft Allstar- S75130 | 2019 | 12+2 Wheelchairs | $66875 |
| Ford Starcraft Allstar- S68886 | 2019 | 12+2 Wheelchairs | $63999 |
| Ford F-650 Starcraft Allstar XL –S30112 | 2019 | 37 | $114950 |
| Ford Allstar MVP- S74523 | 2019 | 24 | $63985 |
| Ford Metro Link – S38175 | 2018 | 25 | $65365 |
| Ford Eldorado Advantage- S28179 | 2016 | 21 | $23875 |
| Ford Goshen Impulse – S12145 | 2015 | 24 | $22900 |
| Mercedes Sprinter Battisti-S65999 | 2014 | 14 | $62500 |
| Chevrolet Collins NexBus MFSAB- B72278 | 2013 | 14 | $24900 |
The cost of building shuttle stops according to (Schmitt, 2018) this can cost from$5500 to $12000.
Task 3 Survey the campus for locations of new shuttle stops
Two documents containing maps of North and South Campus were studied. I deem it wise to build new stops right next to the existing ones to minimize the need for a thorough field survey.
Task 4 Research into the effectiveness of increasing the frequency of shuttle operations
This graph produced by (Brechan, 2017) showing the effect of increasing frequency on the genereation of journeys was studied.
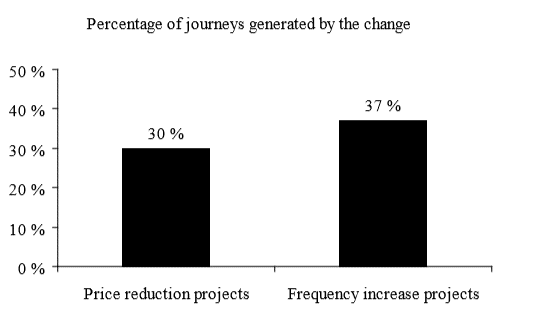
Figure 2 showing Average effect of price reduction and frequency increase projects (Brechan, 2017)
In the report (Steven Higashide, 2016), one of the recommendations to transit agencies was to increase the frequency of service on routes with a high ridership potential. The bar chart below exists in the report and it shows the facets of a transit service most valuable to users. Service frequency is listed as the second most important aspect.
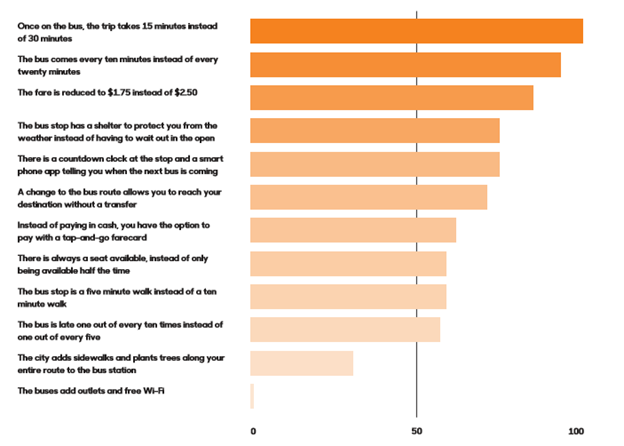
Figure 3 showing Relative importance of service improvements (Steven Higashide, 2016)
In another report by (Torrey Lyons, 2017) the authors recommend increasing service frequency instead of spatial coverage. Using a structural Equation Modelling, it was seen that ridership is more responsive to frequency than coverage. With respect to ridership, the elasticity of route density was 0.947 while that of frequency was 1.175.
Figure 4 showing ridership response with respect to frequency (Torrey Lyons, 2017)
The Mohring effect, as named in a 1972 paper by Herbert Mohring, states that increasing the frequency of a transit service with demand would shorten the waiting time at stops. Therefore, the stops would be emptied before being filled and students will not have to endure adverse weather conditions.
CONCLUSION
These are my conclusions regarding the results of the research methods performed above
Level of student concern
The results of the 58 student survey indicate that about 64% of them are heavily affected by the stop inadequacy during winter. The results show that a significant amount of students are affected by this matter, enough for appropriate action to be taken. Admittedly, this is a small sample size compared to the total number of students using public transportation within the school, but I remain confident that these results will be replicated even with an increase in sample size.
Possible solution to the problem
Increasing shuttle frequency is the most common suggestion. The number of shuttles are currently adequate for students and thus no need to increase them. Owing to the fact the inadequacy of stops is highlighted only during winter, it is reasonable to adjust the waiting times in this season to get rid of congestion before it happens. When compared to the other suggestions, this is the most economically feasible.
Possible locations of new stops
The new stops have been selected to be as close to the existing ones as possible. The current locations on the map are appropriate for the route and I aimed at maintaining this familiarity. Construction can begin during summer and be completed before the cold of the winter.
Effects of increasing frequency
According to research done on other public transport networks, this will reduce the waiting times thus increase the level of service of shuttles. Increasing the number of shuttles would lead to longer queues of people waiting to board them and building new stops would cost more. Frequency is seen as one of the major factors contributing to the success of any transit system and UB is no exception.
RECCOMENDATIONS
Based upon my research, these are my recommendations.
- Increase the frequency of shuttles
This should be done gradually to allow the stakeholders enough time to adjust. I suggest that it is done in phases up until when the system is at its optimum. If, at this point, there are still students having to wait outside during winter, then the next step to be taken should be to build more stops as it is cheaper than buying more shuttles.