


Research Question: Does age affect the trust in government index?
Data Used: Afrobarometer dataset
Correlation Analysis
The number of respondents recorded in the data set is 10250. The mean age of the respondents is 37.01 with a standard deviation of 14.536 as shown in figure 1 below. Correlation analysis was used to test whether there is a relationship between age and the trust in government index and the type of relationship. As shown in the SPSS output of the correlation analysis using age and trust in government variables in figure 2, the two variables have a positive correlation with the correlation coefficient being -.090. Therefore, the relationship between the variables is positive; when one variable increases, the other increases. However, the relationship between the two variables is weak since the correlation coefficient is closer to zero that it is to one. The assumptions of the analysis are that the level of measurement for the two variables is continuous, related pairs, and linearity. These assumptions have been met since both variables are continuous. Also, each participant has a pair of values for the two variables. Outliers have been coded as missing values and the test of linearity is shown in figure 3. The significant value for the linearity test is .585 which is greater than the alpha (.05). Therefore, it can be concluded that there is a linear relationship between the two variables.
| Descriptive Statistics | |||||
| N | Minimum | Maximum | Mean | Std. Deviation | |
| Q1. Age | 10250 | 18 | 99 | 37.01 | 14.536 |
| Valid N (listwise) | 10250 | ||||
Figure 1: Descriptive Statistics for the Age Variable
| Correlations | |||
| Q1. Age | Trust in Government Index (higher scores=more trust) | ||
| Q1. Age | Pearson Correlation | 1 | .090** |
| Sig. (2-tailed) | .000 | ||
| N | 10250 | 7744 | |
| Trust in Government Index (higher scores=more trust) | Pearson Correlation | .090** | 1 |
| Sig. (2-tailed) | .000 | ||
| N | 7744 | 7789 | |
| **. Correlation is significant at the 0.01 level (2-tailed). | |||
Figure 2: Correlation Analysis for the Age and Trust in Government Index Variable
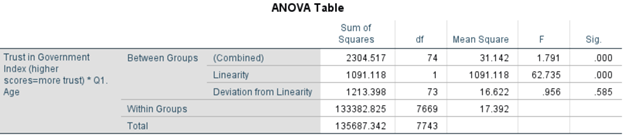
Figure 3: Test of Linearity
Bivariate Regression Analysis
In the bivariate regression analysis, age is the independent variable and therefore the explanatory variable while trust in government index is the dependent variable. The dataset meets all the assumptions for this type of analysis. These assumptions include independence, normality, homoscedasticity, and linearity. Independence indicates that the observations are independent of one another. Normality implies that for every observation X, its correspondent Y is normally distributed. Homoscedasticity indicates that the data is randomly distributed while the test of linearity is shown in figure 3.
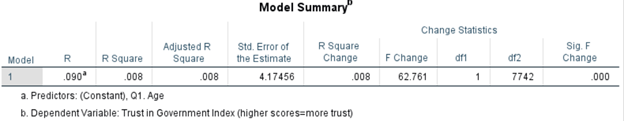
Figure 4: Bivariate Regression Analysis
The output for bivariate analysis as shown in figure 4 gives R and R2 values. The R value is the simple correlation and is .090, which indicates a low degree of correlation. The R2 implies how much of the dependent variable, trust in government index can be explained by the independent variable, age. In this case, 0.8% can be explained, which is very small. Figure 5 is the ANOVA table, which explains how well the regression model fits the data. It shows that the regression model predicts the dependent variable significantly well because the p value (.000) is less than 0.05, thereby implying that the regression model statistically significantly predicts the outcome variable.
| ANOVA | ||||||
| Model | Sum of Squares | df | Mean Square | F | Sig. | |
| 1 | Regression | 1093.740 | 1 | 1093.740 | 62.761 | .000b |
| Residual | 134919.635 | 7742 | 17.427 | |||
| Total | 136013.375 | 7743 | ||||
| a. Dependent Variable: Trust in Government Index (higher scores=more trust) | ||||||
| b. Predictors: (Constant), Q1. Age | ||||||
Figure 5: Statistical Significance of the Regression Model.
The results of this analysis can be used to speculate how the age of an individual affects their trust in government. According to Gozgor (2021), age is one of the potential determinants of public trust in government. It is one among other demographic factors that influence this variable. Despite the weak relationship between the two variables from the analysis, the correlation is there and can be used as a basis for more research. This can then facilitate a drive towards enhancing the trust that the public has on the government across all age groups.