Postoperative high blood sugar level has shown to have multiple effects on patients who have undergone coronary artery bypass grafting surgery, moreover, there are still many uncertainties regarding the outcome of patients who have undergone the procedure Myakina, N. E. E. (2014). This study focused on the glucose variability increase associated with major adverse events after Coronary Artery Bypass. A structured protocol regarding cardiac surgery exists with the role of BbA1c (an elevated preoperative hemoglobin A1c used in addressing the prediction of movement and mortality results after coronary artery bypass E Duncan, A. (2012). Various evidence-based studies have presented answers concerning clinical questions. Tabulation of; dates and countries of publication, groups of patients studied, the type of study undertaken, the author’s name, and the titles of journals cited have all been done.
These studies have so far presented already analysed relationships that occur between preoperative BbA1c levels the possible postoperative findings that come out as of coronary artery bypass graft (CABG) in the three groups of patients namely; non-diabetic, diabetic, and mixed patients. Results indicate an important increase of late and early mortality in high levels of HbA1c, this is regardless of diabetic diagnosis Nardella, S. (2015).
A study conducted on a 30 days survival was worse in patients who had a history of undiagnosed cases of diabetes and increases HbA1c as compared to the better controlled (HbA1c ›6%; odds ratio of 1.55 with CI of (1.25-2.01); P=0.0005). a study on early deaths in diabetic patients showed no difference with those of normal patients HbA1c level was (P=1.00), mixed results on the movement came out. Identification of the increase in infection rate in patients that have uncontrolled HbA1c irrespective of their diabetic status was made and the following results obtained on their sternal wound drawn; superficial (P= 0.009), minor infections(P=0.007), and deep infections (P=0.020).
There is an association between elevated Hba1c and normal HbA1c in elongated stay in the hospital under the intensive care unit wing, this also predicted the reduction of intraoperative insulin sensation in diabetic patients.
With all these, therefore, elevated HbA1c can be referred to as the predictor of death and movement in patients regardless of their diabetes diagnosis history. The death risk for CABG is more at HbA1c levels >9% Xia, J. (2019).
Introduction
Diabetes mellitus can be used to predict movement and mortality outcomes in patients that are undergoing coronary artery bypass grafting. As association exists between sternal wound infections at different points (superficial and deep) infections, renal failure, long terms effects of coronary artery bypass grafting, and increased hemoglobin A1c Xia, J. (2019). to reduce these complications, insulin infusions and postoperative glucose must be controlled Lawton, J. S. (2019). There is a demonstration indicating that liberal glucose control; 180mg/L in an insulin infusion is powerful as compared to tight control of 120mg/L, this only works when major adverse events are reduced with fewer hypoglycemic events than tight control. Logistic regression shows MAEs are associated with an increase in postoperative glucose mostly during the first half-day of infection as a result, a 95% confidence interval is obtained Clement, J. S. (2019).
Increasing the glucose variability adversely affects the function of the cardiac after coronary artery bypass grafting and myocardial infarction, this refers to swings in glucose levels during the day, this includes postprandial changes as well as hyperglycemic and hypoglycemic episodes Umpierrez, G. (2014).
In non-diabetic and diabetic patients, increased GV is associated with increased MAEs after cardiac death and this brings the need for revascularization that should be done within 30 days Oddo, M. (2011). This should be measured by doing continuous glucose monitoring.
Objective
To determine the effect of postoperative glucose variability on major adverse effects as a result of coronary artery bypass grafting.
Methodology
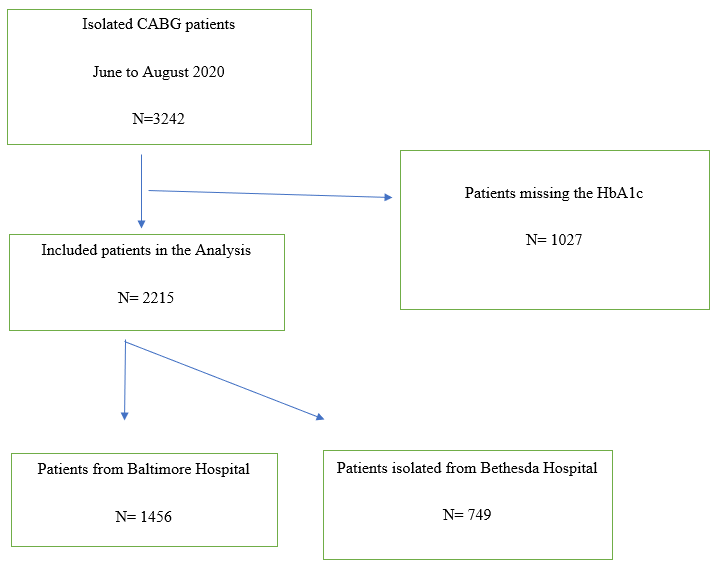
In this study, patients who underwent coronary artery bypass grafting isolation at two specific hospitals were evaluated. The patients were isolated at two hospitals in Maryland (Baltimore and Bethesda). This study was conducted in two months between June and August 2020 after approval by the administration of both the selected hospitals Henry, T. D., … & Giacoppo, D. (2017).
If the patients did not have any preoperative HbA1c in their 12 weeks before surgery they were excluded. The data obtained showed that about 96% of the patients had gone through coronary artery bypass grafting Parvizi, J. (2018). This would mean that the selected patients did not have complete data in the Society of Thoracic Surgeons (STS) Adult Cardiac Surgery Database as shown below.
The flow diagram below of HbA1c is showing the number of patients that were undergoing coronary artery bypass grafting in the selected hospitals between June and August 2020 Umpierrez, G. (2014).
Extraction of preoperative data was from the STS database or electronic medical record.
They maintain the objective of glucose level range between100-139mg/dL, an hourly point care testing was conducted by a nurse to monitor the changes in the glucose level of the patients that were subjected to coronary artery bypass grafting isolation Groves, D. S. (2011). The nurse further injected the patients with insulin and monitored their subcutaneous insulin to have a glucose level of less than 180mg/dL. This was conducted as soon as the morning of the postoperative day.
| Preoperative factors and 24 hours mean glucose |
Odds ratio |
Lower 95% CI |
Upper 95% CI |
P-value |
| Age | 1.02 | 1.01 | 1.04 | 0.003 |
| Hemoglobin A1c | 0.92 | 0.84 | 1.02 | 0.12 |
| Ejection fraction | 0.97 | 0.96 | 0.98 | <0.001 |
| Hyperlipidaemia | 1.44 | 1.01 | 2.05 | 0.046 |
| Hypertension | 0.63 | 0.41 | 0.98 | 0.042 |
| Square root of cardiopulmonary bypass time (minutes) | 1.17 | 1.08 | 1.26 | <0.001 |
| The square root of total blood products transfused in OR | 1.53 | 1.38 | 1.70 | <0.001 |
| 24-hour mean glucose | 1.017 | 1.010 | 1.024 | <0.001 |
| constant | <0.01 | <0.001 |
Operating room = OR and confidence interval = CI
Glucose Variability Calculations.
This was done by measuring the coefficient of variation, standard deviation, and mean amplitude of glycemic excursions during the first half-day and full-day intervals Cottin, Y. (2019). The coefficient of variation is the dividend of the standard variation by the mean, this is expressed in percentage (%). Mean amplitude of glycemic excursions (MAGE) measures the glucose level variability based on mealtime and shows a glucose change greater than one standard deviation of glucose level. When measurements occur in one hour, the coefficient of variation (CV) can be used as the primary measure of glucose variability. This is because it is a better measurement for a whole day’s glucose variability. Calculations of low glucose events (glucose <70mg/dL), high glucose events (>180mg/dL) and mixed events (<50mg/dL) were done during both half and whole day. High glucose variability of the first half was monitored by the coefficient of variation Kraus, W. E. (2012). This was found to have the highest dividend. The same approach was used for the full-day determination of the glucose variability.
| Preoperative factors and 24 hours mean glucose | Odds ratio | Lower 95%
CI |
Upper 95%
CI |
P-value |
| Age | 1.02 | 1.01 | 1.04 | 0.002 |
| Hemoglobin A1c | 0.94 | 0.85 | 1.04 | 0.21 |
| Ejection fraction | 0.97 | 0.96 | 0.98 | <0.001 |
| Hyperlipidaemia | 1.43 | 1.00 | 2.04 | 0.050 |
| Hypertension | 0.63 | 0.40 | 0.98 | 0.039 |
| Square root of cardiopulmonary bypass time (minutes) | 1.16 | 1.08 | 1.25 | < 0.001 |
| Square root of total blood products transfused in OR | 1.51 | 1.37 | 1.67 | < 0.001 |
| 24-hour mean glucose | 1.22 | 1.09 | 1.37 | 0.001 |
| constant | 0.01 | <0.001 |
Glucose variability is measured in % coefficient of variation. Odds ratio = 10% change in the coefficient of variation.
Assessment
Major adverse events include the following;
- Renal failure
- Pneumonia
- Stroke
- Postoperative cardiac arrest
- Sepsis
- Reoperation
- 30-day death.
These were the expected primary major adverse events after the operation Benalia (2019).
Data analysis
Coefficient of variation was used to evaluate the postoperative glucose variability, it was regarded as a discrete variable and put in the category of the continuous variables, thereafter analysis was done to compare the factors between the upper 95% and lower 95% CI was done for the first 12-hours and 24-hours. These continuous variables were means of standard deviation + or -, these data were compared with the student’s t-test. The number of patients were analysed using X2 test.
Selection model was used to build a method as described by Hosmer and Zhang to form a model that includes preoperative and operative factors, this was done for the multivariable logistic regression. Variables which has p-value less than 0.25 were from patients who had issues with major adverse events and these data was also included in the logistic regression, the values that did not have values of p>0.005 were removed thus not used.
Except the data for cardiopulmonary bypass time and those for blood products obtained in the theatre, all other continuous variables showed a linear relationship as compared to the logit of the major adverse events. A transformation of square root was these two variables was performed so as to make them linearly related. It was only significant to asses the interaction between hypertension and hyperlipidaemia, this is because of their p-value ( p=0.015), this assessment was done using the Hosmer-Lemeshow test. Models to determine the effect of postoperative mean of glucose and glucose variability were done, the model used was logistic regression. SPSS statistical analysis was used during the analysis of these data.
Results
A table showing multivariate logistic regression of postoperative glucose variability and major adverse events.
| Preoperative factors and 24 hours mean glucose | Odds ratio | Lower 95%
CI |
Upper 95%
CI |
P-value |
| Age | 1.02 | 1.01 | 1.04 | 0.003 |
| Hemoglobin A1c | 0.92 | 0.84 | 1.02 | 0.12 |
| Ejection fraction | 0.97 | 0.96 | 0.98 | <0.001 |
| Hyperlipidaemia | 1.43 | 1.00 | 2.04 | 0.050 |
| Hypertension | 0.63 | 0.40 | 0.98 | 0.038 |
| Square root of cardiopulmonary bypass time (minutes) | 1.16 | 1.07 | 1.25 | < 0.001 |
| Square root of total blood products transfused in OR | 1.52 | 1.37 | 1.68 | < 0.001 |
| 24-hour mean glucose | 1.013 | 1.08 | 1.018 | <0.001 |
| constant | 0.003 | <0.001 |
A table showing multivariate logistic regression of postoperative glucose variability and major adverse events.
| Preoperative factors and 24 hours mean glucose | Odds ratio | Lower 95%
CI |
Upper 95%
CI |
P-value |
| Age | 1.02 | 1.01 | 1.04 | 0.003 |
| Hemoglobin A1c | 0.97 | 0.88 | 1.07 | 0.54 |
| Ejection fraction | 0.97 | 0.96 | 0.98 | <0.001 |
| Hyperlipidaemia | 1.49 | 1.05 | 2.13 | 0.027 |
| Hypertension | 0.62 | 0.40 | 0.97 | 0.036 |
| Square root of cardiopulmonary bypass time (minutes) | 1.15 | 1.07 | 1.24 | < 0.001 |
| Square root of total blood products transfused in OR | 1.52 | 1.38 | 1.68 | < 0.001 |
| 24-hour mean glucose | 1.06 | 0.87 | 1.29 | 0.58 |
| constant | 0.02 | <0.001 |
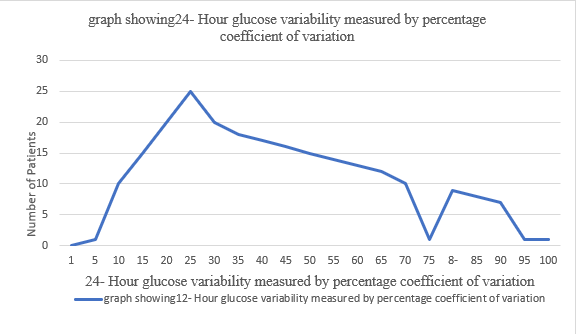
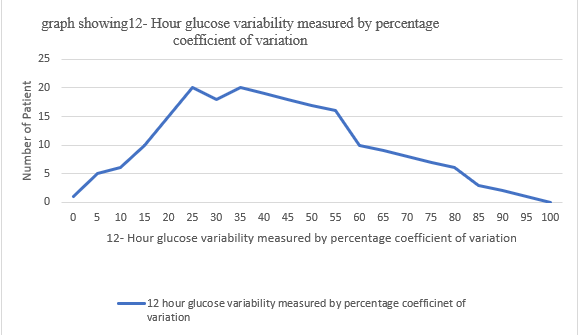
According to the above results, glucose variability was high after 12 hours while high glucose level (glucose>180mg/dL), low glucose levels (<50mg/dL) and mixed glucose levels (<70mg/dL) was seen both after 12 hours and 24 hours. Patients having high glucose variability after 24 hours showed signs of major adverse events than those that showed low levels glucose variability, this can be demonstrated by the following ratios ( 15.1% to 10% therefore p<0.001), these results were realised as a consequence of reoperation on the patients and the deaths seen after 30 days in patients with high glucose variability after 24 hours.
Discussion
Based on the screening method used p<0.25, the above regression identified 7 covariates after 12 hours odds ratio was recorded as (OR = 1.013, 95% CI 1.008- 1.018, p<0.001). after 24 hours (OR =1.017, 95% CI 1.010-1.024, p<0.001).
12 hours glucose variability however did not show major adverse events (OR= 1.06, 95% CI 0.87- 1.19, p<0.58). for every 10% increase in the 24 hours glucose variability, a 22% increase in the major adverse events was recorded, this indicated that increased preoperative HbA1c can be used to predict major adverse events in the multivariate logistic regression model as it is indicated in the model that all p<0.05; these includes the postoperative mean glucose and postoperative glucose variability.