


Prologis Company
The Company’s Strategy
Prologis Inc. is a global firm that focuses on operating as well as development of real estates. The organization operates in Asia, America, and Europe. The key strategy for the organization is to extend the organization sales and market share in investment management segment as well as real estate operations. The organization is thus focusing on market penetration. This study focuses on financial analyses of the organization, assessing whether it is a viable investment destination
SWOT Analysis: Strengths Weaknesses; Opportunities; Threats
Prologis inc. has internal as well as external factors that affect its operations and viability in the industry. In terms of strengths, the organization expects to grow its revenues by 7.3% in 2015 accompanied by a rise of its revenues by 4.1% in 2016 ( Prologis Inc 37). This has the potential of significantly enhancing the organizations returns as well as market share in the industry.
In terms of internal weaknesses, the organization reports that there is expected delay in the manner in which it expects to execute its laid out projects. This will delay the attainment of the organization goals and objectives. The organization further lacks capital for future acquisitions reducing its ability to ability to expand
In terms of opportunities, the organization will expand its operations to new markets, increasing its ability to create a strong portfolio of industrial products around the world.
In its annual reports, the organization identifies rise in interest rates as one of the key threats facing it. Rise in interest rates increases the cost of doing business by the organization. Sharp decline in demand of rental rates is also expected to reduce growth in sales volume in 2016.
- The Company’s Organizational Structure
The company is headed by a chief executive officer who is assisted by regional and department heads. This enables it to diversify its operations. The organization has divided its operations to investment management segments as well as real estate development segment.
- The Company’s Culture, Peers, and Industry
The peers of Prologis Inc. tend to have moderate quality ranking between B and B-. They thus do not maintain the highest degree of quality in service delivery. Nevertheless, they have differing level of market capitalization with Prologis Inc having $21.628 million in market capitalization as compared to WPT industrial REIT which has $ 326 million in market capitalization.
1.3 Market share
The players’ market share in the industry indicates the level of control that they have on industry forces. This is as indicated below
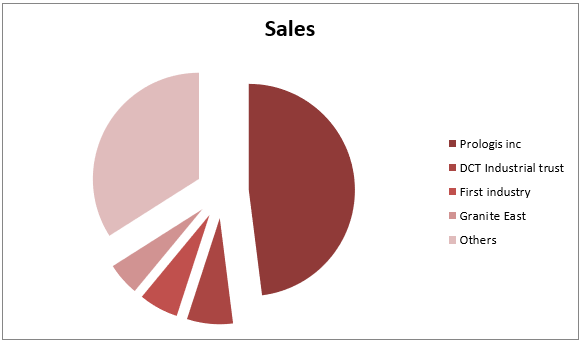
The above indicated companies are the key competitors in the industry. In terms of comparative advantage, Prologis Inc. has wider global market coverage exposing to wider market as compared to the rest of the players in the industry whose market share is largely limited (Fridson, and Fernando 33).
- Products and Services
The organization focus is investment management as well as real estate development. The real estate industry is a capital extensive. This indicates that Prologis Inc. with the highest level of capitalization in the market is in a better position to exploit opportunities in the market as compared to competing firms.
Financial Conditions and Ratio Analysis
As at 2014 financial year, the organization grew its net profit margin by 41.99% as compared to 11.96%. At the same time, return on equity was higher than that of the industry at 4.52% as compared to 2.63%. Debt to equity ratio is equally very low at 0.67 as compared to 1.75 reported by the industry. This indicates the high level of risk of insolvency that is facing other players in the industry as compared to the organization.
Financial ratio analysis
- Debt-to-Equity = Total Liabilities / Shareholders Equity
Between 2006 and 2014, the organization has recorded sharp decline in debt to equity from 1.77 to 0.68. This indicates the reducing risk of insolvency that the organization is exposed.
- Debt-to-Total Market Capitalization= Total Debt/ (Number of shares outstanding * Current market price of the stock)
Total debt to market capitalization reduced from 0.66 to 0.68. This indicates the reducing level of exposure to the risk of insolvency.
- Interest Coverage Ratio = EBIT / Interest Expense
Interest coverage ratio reduced in 2014
- Cash Flow to Debt Ratio = Operating Cash Flow / Total Debt
| Amount in $ Millions | 2010 | 2013 | |||
| Amount | Ratio | Amount | Ratio | ||
| Free cash flow to debt ratio | operating cash flow/total debt | 241/6506 | 0.03704273 | 485/9011 | 0.05382311 |
Source: Prologis Inc 1
- Return on Equity= Net Income / Shareholder’s Equity
The ratio increased from -26.3% in 2010 to 4.5% in 2014. This indicates the increasing ability of the entity to reward those providing equity financing (Lee John and Cheng 48).
- Return on Assets = Net Income / Total Assets
Return on total assets increased from -11.9% in 2010 to 2.5% in 2014. This indicates a rise in the ability of the organization to generate sales from every dollar invested in both equity and debt investors in the organization
- Net Profit Margin = Net Profit / Net Sales
Since 2010, net profit margin has increased from -146.5% to 35.3% in 2014 indicating the organization’s ability to genete profits from every dollar made in sales
- EPS = (Net Income – Dividends on Preferred Stock) / Average Outstanding Shares
Earnings per share increased from -0.08 in 2010 to 1.24 in 2014 indicating increasing ability of the organization to reward share holders with profits.
- P/E Ratio= Stock Price per Share / EPS
Price earnings ratio went up from -400 in 2010 to 34.7 in 2014 indicating the increasing confidence among shareholders that the organization will report profits in the future
- Dividend Payout Ratio = Dividends per Common Share / Earnings per Share
| 2010 | 2014 | ||||
| Amount | Ratio | Amount | Ratio | ||
| Dividends per common share/earnings per share | 1.12/-0.08 | -14 | 1.32/1.24 | 1.06451613 | |
The above indicates that dividend per share over earnings per share significantly increased between 2010 and 2014 indicating increased payout of dividends by the organization
- Dividend Yield = Annual Dividend per Share / Stock Price per Share
Dividend yield percentage reduced from 3.5 in 2010 to 3.1 in 2015 indicating the sharp rise in stock price
- EBITDA Multiple= Enterprise Value / EBITDA
EBITDA amounted $ 19.2 million in 2014 while enterprise value amounted to $ 45809 million. This implies that the EBITDA multiple amounted to 2386 times. This indicates that the organization is generating very low level of EBITDA considering its high value
- Enterprise Value= Company’s Debt+ Minority Interest + Preferred Stock+ Market Capitalization
For year 2013, enterprise value amounted to 23187+0+0+13611+9011 = $45809 millions
- Total Invested Capital (TIC)= Total Book Equity+ Total LT Debt – Excess Cash ,
The above value amounted to $13976+$10861- 312 = $ 24,525 million in 2014
- Return on Invested Capital= Net Income/ TIC
Between 2010 and 2013, the ratio increased indicating the ability of the organization to generate profits from invested capital as indicated below
| Amount in $ Millions | 2010 | 2013 | |||
| Amount | Ratio | Amount | Ratio | ||
| Return on invested capital ( | net income/total invested capital | (-1582/14026) | -0.11 | (622/23187) | 0.03 |
Sources: Prologis Inc 1
- DuPont analysis:
ROE = (Sales / Average Assets) x (Net Profits / Sales) x (Average Assets / Average Equity)
| 2010 | 2014 | ||
| Ratio | Formula | Ratio | Ratio |
| asset turnover | sales/average assets | -11.9 | 2.5 |
| Net profit margin | net profits/sales | -145.6 | 35.3 |
| Return on equity | average assets/average equity | -26.3 | 4.5 |
| Du Pont Roe | (Sales / Average Assets) x (Net Profits / Sales) x (Average | -45568.432 | 397.125 |
The above table indicates high growth in return on equity indicating increase in the entity’s profitability
- Financial Analysis
Revenue earnings are projected to grow by 0.6 next year and 10.2% in 10 years time. earnings will grow by 35.3% next year and 14.2% in 10 years time while free cash flows are expected to grow in 10 years and EBITDA will grow by 10% over the same period.
Financial forecast
| Projected income statement Amount in $ millions | ||||||
| Projected balance sheet | ||||||
| Projected income statement | ||||||
| 2014 | 2015 | 2016 | 2017 | 2018 | 2019 | |
| Revenue | 1760.787 | 1771.351722 | 1781.979832 | 1792.671711 | 1803.427742 | 1814.2483 |
| Cost of sales | 430.787 | 432.079361 | 433.3755991 | 434.6757259 | 435.9797531 | 437.28769 |
| Gross profit | 1330 | 1339.272361 | 1348.604233 | 1357.995985 | 1367.447989 | 1376.9606 |
| Operating expenses | 1010.192 | 1013.222576 | 1016.262244 | 1019.31103 | 1022.368964 | 1025.4361 |
| Operating income | 319.808 | 326.049785 | 332.3419895 | 338.684955 | 345.079025 | 351.52455 |
| Other income and taxes | 419.476 | 420.734428 | 421.9966313 | 423.2626212 | 424.532409 | 425.80601 |
| Net income | 739.284 | 746.784213 | 754.3386208 | 761.9475762 | 769.611434 | 777.33055 |
| Sales grow at 0.6% p. a | ||||||
| Costs grow by 0.3% p a | ||||||
| Projected balance sheet | ||||||
| Current assets | 454.137 | 476.84385 | 500.6860425 | 525.7203446 | 552.0063619 | 579.60668 |
| Noncurrent assets | 25364.086 | 26632.2903 | 27963.90482 | 29362.10006 | 30830.20506 | 32371.715 |
| Total assets | 25818.223 | 27109.13415 | 28464.59086 | 29887.8204 | 31382.21142 | 32951.322 |
| Current liabilities | 627.999 | 659.39895 | 692.3688975 | 726.9873424 | 763.3367095 | 801.50354 |
| Noncurrent liabilities | 11214.715 | 11775.45075 | 12364.22329 | 12982.43445 | 13631.55617 | 14313.134 |
| Total liabilities | 11842.714 | 12434.8497 | 13056.59219 | 13709.42179 | 14394.89288 | 15114.638 |
| Equity | 13975.509 | 14674.28445 | 15407.99867 | 16178.39861 | 16987.31854 | 17836.684 |
| Total liabilities + equity | 25818.223 | 27109.13415 | 28464.59086 | 29887.8204 | 31382.21142 | 32951.322 |
| Financial position grows at 5% per annum | ||||||
| projected cash flow | 2014 | 2015 | 2016 | 2017 | 2018 | 2019 |
| Opening cash491129 | 491.129 | 515.68545 | 541.4697225 | 568.5432086 | 596.9703691 | 626.81889 |
| Cash from operations | 704.531 | 739.75755 | 776.7454275 | 815.5826989 | 856.3618338 | 899.17993 |
| Cash from investing activities | -488.309 | -512.72445 | -538.360673 | -565.278706 | -593.542641 | -623.21977 |
| Cash from financing activities | -337.817 | -354.70785 | -372.443243 | -391.065405 | -410.618675 | -431.14961 |
| Exchange rate effect-18.842 | -18.8423 | -19.784415 | -20.7736358 | -21.8123175 | -22.9029334 | -24.04808 |
| Closing balance | 369.534 | 388.0107 | 407.411235 | 427.7817968 | 449.1708866 | 471.62943 |
| cash will grow by 5% | ||||||
Source: Prologis Inc 1
The above forecast indicates that both financial position and financial performance will improve in the next five years
- Stock Valuation Methods
- Perpetuity Method
PV=C1/ (1+r) 1 +C2/ (1+r) 2+……+C in f / (1+r) in f
PV ={C× (1+g) 1 / (1+i) 1}+{C×(1+g)2 / (1+i) 2} + … + {C×(1+g) I n f / (1+i)I n f}
Where,
D=dividends
R: discount rate
g: growth rate
I: required rate of return
In f: infinite time period
Value per share= PV/No. of shares outstanding
| P=c(1+r)^n(1+g)^n | ||||
| (1+0.045) | (1+0.179) | |||
| C1/R-G | ||||
| Where C is dividend, r return rate and g growth | ||||
| 1.32(1.033)/(0.045-0.033) | ||||
| 113.63 | ||||
- Gordon Growth Model
Stock Price = D (1+g) / (r-g)
Where,
D = Expected dividend per share one year from now
Can also use earnings, free cash flow
k = required rate of return for equity investor
G/g = projected dividend growth rate
r = the investor’s required rate of return
| PO = d1/KS-g | |||
| 1.32*(1.033)/0.045-0.033 | |||
| 113.63 | |||
- Multiples approach- Industry/Peer
- Equity price based multiple
Where
P/E ratio= Share price / Earnings per share (EPS)
Price / cash earnings= Share price / earnings per share plus depreciation amortization and changes in non-cash provisions
Price / book ratio= Share price / book value per share
Dividend yield= Dividend per share / share price
Price / Sales= Share price / sales per share
| 2014 | |||
| P/E ratio | 34.7 | ||
| Price/cash earnings | 31 | ||
| Price to book ratio | 1.6 | ||
| dividend yield | 3.1 | ||
| price/sales | 12.4 | ||
The above indicates high return through dividend yield, price to book and price to sales. Price earnings ratio indicates high consumer confidence on the organization
- Enterprise value based multiple
EV/Sales= Enterprise value / net sales = 200
EV/EBIT and EV/EBITA= Enterprise value / Earnings before interest and taxes (and Amortization) = 131
EV/op. FCF= Enterprise value / Operating Free Cash Flow= 100
EV/ Enterprise FCF= Enterprise value / Free cash flow=71
EV/Invested Capital= Enterprise value / Invested capital = 3.1
- Discounted Cash Flow (DCF)- Scenario/ Sensitivity Analysis
- Forecast and discount free cash flows to the firm (FCFF) for the horizon period.
| Year 1 net cash flow | Discount at 2014 return on equity 4.5% | Column1 |
| 369.354 | 369.354 | |
| 388.0107 | 371.3021053 | |
| 407.41 | 373.0775394 | |
| 427.78 | 374.8621613 | |
| 449.17 | 376.6565987 | |
| 471.63 | 395.4906865 | |
| Total | 2260.743091 |
- Forecast on terminal period.
| terminal value | present value at 4.5% | Column1 |
| $1000m | 802.4510465 | |
| Amount in $ Millions |
- Sum the present values of the horizon and terminal periods to yield firm value.
| annual values Amount in $ Millions | 2260.743091 |
| terminal value | 802.4510465 |
| total present value | 3063.194138 |
- Sensitivity/Scenario Analysis by changing the discount rate, growth rate (at 7 discount rate)
| Year 1 Amount in $ Millions net cash flow | Discounted at 2014 return on equity 7% | Column1 |
| 369.354 | 369.354 | |
| 388.0107 | 362.6268224 | |
| 407.41 | 401.7655952 | |
| 427.78 | 349.1959058 | |
| 449.17 | 342.6696424 | |
| 471.63 | 359.8042689 | |
| Total | 2185.416235 |
| annual values Amount in $ Millions | 2185.416235 |
| terminal value | 712.99 |
| total present value | 2898.406235 |
- Dividing the firm value by the number of shares outstanding yields the estimated per share stock price or Intrinsic value per share.
| annual values in $ Millions | 2185.416235 |
| terminal value | 712.99 |
| total present value | 2898.406235 |
| shares $788.640 million | 788.64 |
| value per share | 3.675195571 |
Source: Prologis Inc 1
- Decision/Trade Recommendations: Buy, Hold, Sell
Option 3: Intrinsic value< stock price
The investors should sell stock, buy put option, and write call option. This is based on the understanding that they would make a loss when the actual stock value materializes in the stock market.
In its annual reports, the organization identifies rise in interest rates as one of the key threats facing it. Rise in interest rates increases the cost of doing business by the organization. Sharp decline in demand of rental rates is also expected to reduce growth in sales volume in 2016.
- The Company’s Organizational Structure
The company is headed by a chief executive officer who is assisted by regional and department heads. This enables it to diversify its operations. The organization has divided its operations to investment management segments as well as real estate development segment.
- The Company’s Culture, Peers, and Industry
Similarities and differences
The peers of Prologis Inc. tend to have moderate quality ranking between B and B-. They thus do not maintain the highest degree of quality in service delivery. Nevertheless, they have differing level of market capitalization with Prologis Inc having $21.628 million in market capitalization as compared to WPT industrial REIT, which has $ 326 million in market capitalization.
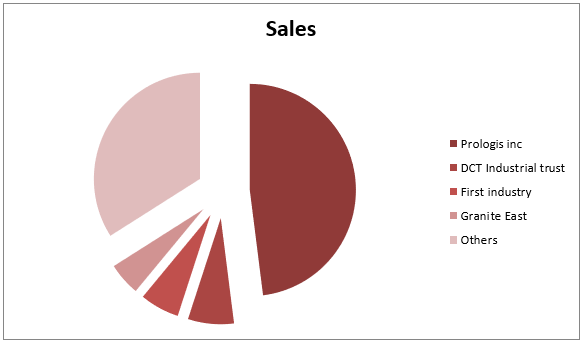
Market share
The players’ market share in the industry indicates the level of control that they have on industry forces. This is as indicated below
- Who are the main competitors?
The above indicated companies are the key competitors in the industry
- Comparative Advantages?
In terms of comparative advantage, Prologis Inc. has wider global market coverage exposing to wider market as compared to the rest of the players in the industry whose market share is largely limited (Fridson, and Fernando 33).
- Products and Services
- What products and services does the company offer?
The organization focus is investment management as well as real estate development.
- Comparative Advantages?
The real estate industry is a capital extensive. This indicates that Prologis Inc. with the highest level of capitalization in the market is in a better position to exploit opportunities in the market as compared to competing firms.
- Financial Conditions and Ratio Analysis
As at 2014 financial year, the organization grew its net profit margin by 41.99% as compared to 11.96%. At the same time, return on equity was higher than that of the industry at 4.52% as compared to 2.63%. Debt to equity ratio is equally very low at 0.67 as compared to 1.75 reported by the industry. This indicates the high level of risk of insolvency that is facing other players in the industry as compared to the organization.
- Financial ratio analysis
- Debt-to-Equity = Total Liabilities / Shareholders Equity
Between 2006 and 2014, the organization has recorded sharp decline in debt to equity from 1.77 to 0.68. This indicates the reducing risk of insolvency that the organization is exposed.
- Debt-to-Total Market Capitalization= Total Debt/ (Number of shares outstanding * Current market price of the stock)
Total debt to market capitalization reduced from 0.66 to 0.68. This indicates the reducing level of exposure to the risk of insolvency.
- Interest Coverage Ratio = EBIT / Interest Expense
Interest coverage ratio reduced in 201
- Cash Flow to Debt Ratio = Operating Cash Flow / Total Debt
| Amount in $ Millions | 2010 | 2013 | |||
| Amount | Ratio | Amount | Ratio | ||
| Free cash flow to debt ratio | operating cash flow/total debt | 241/6506 | 0.03704273 | 485/9011 | 0.05382311 |
Source: Prologis Inc 1
- Return on Equity= Net Income / Shareholder’s Equity
The ratio increased from -26.3% in 2010 to 4.5% in 2014. This indicates the increasing ability of the entity to reward those providing equity financing (Lee John and Cheng 48).
- Return on Assets = Net Income / Total Assets
Return on total assets increased from -11.9% in 2010 to 2.5% in 2014. This indicates a rise in the ability of the organization to generate sales from every dollar invested in both equity and debt investors in the organization
- Net Profit Margin = Net Profit / Net Sales
Since 2010, net profit margin has increased from -146.5% to 35.3% in 2014 indicating the organization’s ability to genete profits from every dollar made in sales
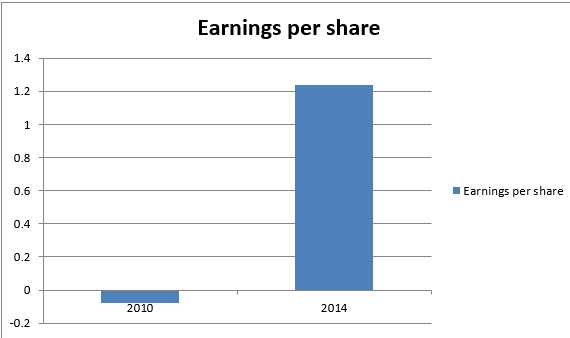
- EPS = (Net Income – Dividends on Preferred Stock) / Average Outstanding Shares
Earnings per share increased from -0.08 in 2010 to 1.24 in 2014 indicating increasing ability of the organization to reward shareholders with profits. This is depicted in the graph below
- P/E Ratio= Stock Price per Share / EPS
Price earnings ratio went up from -400 in 2010 to 34.7 in 2014 indicating the increasing confidence among shareholders that the organization will report profits in the future
- Dividend Payout Ratio = Dividends per Common Share / Earnings per Share
| 2010 | 2014 | ||||
| Amount | Ratio | Amount | Ratio | ||
| Dividends per common share/earnings per share | 1.12/-0.08 | -14 | 1.32/1.24 | 1.06451613 | |
The above indicates that dividend per share over earnings per share significantly increased between the years 2010 and 2014 indicating increased payout of dividends by the organization
- Dividend Yield = Annual Dividend per Share or Stock Price per Share
Dividend yield percentage reduced from 3.5 in 2010 to 3.1 in 2015 indicating the sharp rise in stock price
- EBITDA Multiple= Enterprise Value / EBITDA
EBITDA amounted $ 19.2 million in 2014 while enterprise value amounted to $ 45809 million. This implies that the EBITDA multiple amounted to 2386 times. This indicates that the organization is generating very low level of EBITDA considering its high value
- Enterprise Value= Company’s Debt+ Minority Interest + Preferred Stock+ Market Capitalization
For year 2013, enterprise value amounted to 23187+0+0+13611+9011 = $45809 millions
- Total Invested Capital (TIC)= Total Book Equity+ Total LT Debt – Excess Cash
In the year 2014, this amounted to $13976+$10861- 312 = $ 24,525 million.
- Return on Invested Capital= Net Income/ TIC
Between 2010 and 2013, the ratio increased indicating the ability of the organization to generate profits from invested capital as indicated below
| Amount in $ Millions | 2010 | 2013 | |||
| Amount | Ratio | Amount | Ratio | ||
| return on invested capital ( | net income/total invested capital | (-1582/14026) | -0.11 | (622/23187) | 0.03 |
Sources: Prologis Inc 1
- DuPont analysis:
ROE = (Sales / Average Assets) x (Net Profits / Sales) x (Average Assets / Average Equity)
| 2010 | 2014 | ||
| Ratio | Formula | Ratio | Ratio |
| asset turnover | sales/average assets | -11.9 | 2.5 |
| net profit margin | net profits/sales | -145.6 | 35.3 |
| return on equity | average assets/average equity | -26.3 | 4.5 |
| Du Pont Roe | (Sales / Average Assets) x (Net Profits / Sales) x (Average | -45568.432 | 397.125 |
The above table indicates high growth in return on equity indicating increase in the entity’s profitability
- Financial Analysis
- Revenues, Earnings, EBITDA, FCFs, Potential Growth Rates, WACC.
Revenue earnings are projected to grow by 0.6 next year and 10.2% in 10 years time. earnings will grow by 35.3% next year and 14.2% in 10 years time while free cash flows are expected to grow in 10 years and EBITDA will grow by 10% over the same period.
Financial forecast
| projected income statement | ||||||
| Projected balance sheet | ||||||
| Projected income statement | ||||||
| 2014 | 2015 | 2016 | 2017 | 2018 | 2019 | |
| Revenue | 1760.787 | 1771.351722 | 1781.979832 | 1792.671711 | 1803.427742 | 1814.2483 |
| cost of sales | 430.787 | 432.079361 | 433.3755991 | 434.6757259 | 435.9797531 | 437.28769 |
| gross profit | 1330 | 1339.272361 | 1348.604233 | 1357.995985 | 1367.447989 | 1376.9606 |
| operating expenses | 1010.192 | 1013.222576 | 1016.262244 | 1019.31103 | 1022.368964 | 1025.4361 |
| operating income | 319.808 | 326.049785 | 332.3419895 | 338.684955 | 345.079025 | 351.52455 |
| other income and taxes | 419.476 | 420.734428 | 421.9966313 | 423.2626212 | 424.532409 | 425.80601 |
| net income | 739.284 | 746.784213 | 754.3386208 | 761.9475762 | 769.611434 | 777.33055 |
| sales grow at 0.6% p. a | ||||||
| costs grow by 0.3% p a | ||||||
| Projected balance sheet | ||||||
| current assets | 454.137 | 476.84385 | 500.6860425 | 525.7203446 | 552.0063619 | 579.60668 |
| noncurrent assets | 25364.086 | 26632.2903 | 27963.90482 | 29362.10006 | 30830.20506 | 32371.715 |
| Total assets | 25818.223 | 27109.13415 | 28464.59086 | 29887.8204 | 31382.21142 | 32951.322 |
| current liabilities | 627.999 | 659.39895 | 692.3688975 | 726.9873424 | 763.3367095 | 801.50354 |
| noncurrent liabilities | 11214.715 | 11775.45075 | 12364.22329 | 12982.43445 | 13631.55617 | 14313.134 |
| Total liabilities | 11842.714 | 12434.8497 | 13056.59219 | 13709.42179 | 14394.89288 | 15114.638 |
| Equity | 13975.509 | 14674.28445 | 15407.99867 | 16178.39861 | 16987.31854 | 17836.684 |
| total liabilities + equity | 25818.223 | 27109.13415 | 28464.59086 | 29887.8204 | 31382.21142 | 32951.322 |
| Financial position grows at 5% per annum | ||||||
| projected cash flow | 2014 | 2015 | 2016 | 2017 | 2018 | 2019 |
| Opening cash491129 | 491.129 | 515.68545 | 541.4697225 | 568.5432086 | 596.9703691 | 626.81889 |
| cash from operations | 704.531 | 739.75755 | 776.7454275 | 815.5826989 | 856.3618338 | 899.17993 |
| cash from investing activities | -488.309 | -512.72445 | -538.360673 | -565.278706 | -593.542641 | -623.21977 |
| cash from financing activities | -337.817 | -354.70785 | -372.443243 | -391.065405 | -410.618675 | -431.14961 |
| Exchange rate effect-18.842 | -18.8423 | -19.784415 | -20.7736358 | -21.8123175 | -22.9029334 | -24.04808 |
| closing balance | 369.534 | 388.0107 | 407.411235 | 427.7817968 | 449.1708866 | 471.62943 |
| cash will grow by 5% | ||||||
Source: Prologis Inc 1
The above forecast indicates that both financial position and financial performance will improve in the next five years
- Stock Valuation Methods
- Perpetuity Method
PV=C1/(1+r)1 +C2/(1+r)2+………..+Cinf/(1+r)inf
PV ={C×(1+g)1 / (1+i)1}+{C×(1+g)2 / (1+i) 2} + … + {C×(1+g) inf / (1+i)inf}
where,
C: cash flow/dividends/ earnings per share/ free cash flow
r: discount rate
g: growth rate
i: required rate of return
inf: infinite time period
Value per share= PV/No. of shares outstanding
| P=c(1+r)^n(1+g)^n | ||||
| (1+0.045) | (1+0.179) | |||
| C1/R-G | ||||
| Where C is dividend, r return rate and g growth | ||||
| 1.32(1.033)/(0.045-0.033) | ||||
| 113.63 | ||||
- Gordon Growth Model
Stock Price = D (1+g) / (r-g)
Where,
D = Expected dividend per share one year from now
Can also use earnings, free cash flow
k = required rate of return for equity investor
G/g = projected dividend growth rate
r = the investor’s required rate of return
| PO = d1/ks-g | |||
| 1.32*(1.033)/0.045-0.033 | |||
| 113.63 | |||
- Multiples approach- Industry/Peer
- Equity price based multiple
Where
P/E ratio= Share price / Earnings per share (EPS)
Price / cash earnings= Share price / earnings per share plus depreciation amortization and changes in non-cash provisions
Price / book ratio= Share price / book value per share
Dividend yield= Dividend per share / share price
Price / Sales= Share price / sales per share
| 2014 | |||
| P/E ratio | 34.7 | ||
| Price/cash earnings | 31 | ||
| Price to book ratio | 1.6 | ||
| dividend yield | 3.1 | ||
| price/sales | 12.4 | ||
The above indicates high return through dividend yield, price to book and price to sales. Price earnings ratio indicates high consumer confidence on the organization
- Enterprise value based multiple
EV/Sales= Enterprise value / net sales = 200
EV/EBIT and EV/EBITA= Enterprise value / Earnings before interest and taxes (and Amortization)= 131
EV/op. FCF= Enterprise value / Operating Free Cash Flow= 100
EV/ Enterprise FCF= Enterprise value / Free cash flow=71
EV/Invested Capital= Enterprise value / Invested capital = 3.1
- Discounted Cash Flow (DCF)- Scenario/ Sensitivity Analysis
- Forecast and discount free cash flows to the firm (FCFF) for the horizon period.
| Year 1 net cash flow | Discount at 2014 return on equity 4.5% | Column1 |
| 369.354 | 369.354 | |
| 388.0107 | 371.3021053 | |
| 407.41 | 373.0775394 | |
| 427.78 | 374.8621613 | |
| 449.17 | 376.6565987 | |
| 471.63 | 395.4906865 | |
| Total | 2260.743091 |
- Forecast and discount FCFF for the post-horizon period, called the terminal period.
| terminal value | present value at 4.5% | Column1 |
| 1000 | 802.4510465 | |
- Sum the present values of the horizon and terminal periods to yield firm value.
| annual values | 2260.743091 |
| terminal value | 802.4510465 |
| total present value | 3063.194138 |
- Sensitivity/Scenario Analysis by changing the discount rate, growth rate (at 7 discount rate)
| Year 1 net cash flow | Discounte at 2014 return on equity 7% | Column1 |
| 369.354 | 369.354 | |
| 388.0107 | 362.6268224 | |
| 407.41 | 401.7655952 | |
| 427.78 | 349.1959058 | |
| 449.17 | 342.6696424 | |
| 471.63 | 359.8042689 | |
| Total | 2185.416235 |
| annual values | 2185.416235 |
| terminal value | 712.99 |
| total present value | 2898.406235 |
- Dividing the firm value by the number of shares outstanding yields the estimated per share stock price or Intrinsic value per share.
| annual values | 2185.416235 |
| terminal value | 712.99 |
| total present value | 2898.406235 |
| shares 788.640 milion | 788.64 |
| value per share | 3.675195571 |
Source: Prologis Inc 1
- Decision/Trade Recommendations: Buy, Hold, Sell
Option 3: Intrinsic value< stock price
Recommendation: The investors should sell stock, buy put option, and write call option. This is based on the understanding that they would make a loss when the actual stock value materializes in the stock market.