


Introduction
This report outlines our investment portfolio in New Zealand and Australian stock market for the period 13th April 2020 to 15th May 2020. The report captures the whole model from NZ$1,000,000 capital allocation, to overall performance in relation to the index. Over the period of 4-weeks, the portfolio had a return of 5.82% from an initial investment of NZ$1,000,000. The portfolio is made up of 15 stocks from New Zealand market. The selection of stocks was based on technical and fundamental analysis as explained below. Within the period we download stocks data on daily basis and track the performance using our profit maximizing model (Stripling et al., 2018). This is because, the fundamental building block of a successful portfolio is planning, execution and response/feedback. In the planning phase, capital allocation, asset selection and diversification strategies were formed. Next, the execution phase involved selection of most optimal assets to fit the portfolio with highest return at a minimized risk exposure. Finally, under the feedback phase, we evaluated the performance of our portfolio in relation to our initial investments goals and objectives.
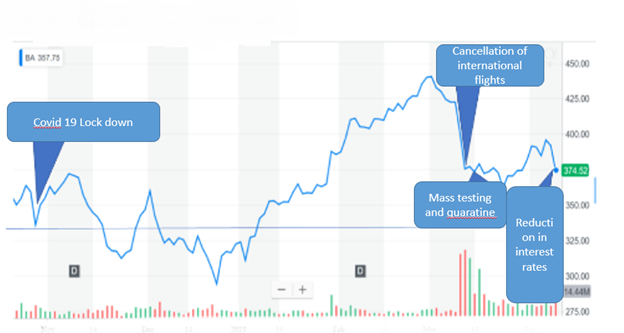
This report presents a summary of the portfolio’s assets allocation, simulation and performance since the start of April 13th to May 15th 2020. The goal was to outperform the NZX 50 index average by 2.5% for the period of investment. The reason for NZX 50 selection as a performance benchmark is because, the portfolio target assets was in shares affected by practices and structures of the 50 companies forming the index. The comparison of the portfolio to composite companies provided a great performance assessment tool of all the shares. Overall, we were not able to hit our target of outperforming NZX 50 by 2.5%, rather the portfolio outperformed the NZX 50 index by 1.61% over the course of the 4 weeks trading phase as shown in Figure 1 below.
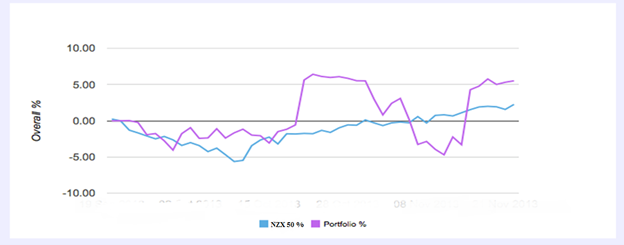
Figure 1: NZX 50 versus our portfolio performance
The guiding policy was to invest more than 10% of the portfolio initial value. However, by overpaying Kiwi property group Limited (KPG.NZ) call option, we broke this policy for once in a strategic move to maximize the returns at a minimized risk. Also, the minimum holding period for long shares was 7 days. 60% of the portfolio value went to common stocks while the remaining 40% to futures and options. However, futures and derivatives were not easy to invest in. this is due to overpriced options which made it unappealing investment for our group due to the high volatility associated with this market.
In terms of strategy operationalization, the portfolio strategic goal was to invest in across all major markets with key focus on high growth companies. This was facilitated by availability of companies’ financial data on public domain. In addition, during this period, companies were releasing earnings performance for the quarter. This was the best period for most investors since, at the time of earnings announcement, companies’ shares tends to be more volatile. This meant high potential growth for a short period of time which was the goal number one for our portfolio.
Investment Strategy
Under this section, we define all a set of rules and guidelines used by investors to allocate capital and selects assets in a portfolio. Since different investors have different objectives, many prefer technical analysis than the prevalent fundamental analysis. Fundamental analysis capture most of the macro economic factors hence forecasting with great accuracy (Bass et al., 2017). Some of the elements captured by investors in fundamental analysis include GDP, Sales changes, Industrial performance indicators and individual firms’ earnings. Through fundamental analysis, investors are able to identify the most attractive stocks based on their investment objective.
The fundamental analysis applies two techniques knows Top-down and Bottom-up forecasting approach. In top down fundamental analysis the forecast starts with economic analysis, followed by industries and finally companies. All these forecasts are interrelated whereby the basis for industrial forecasts is its industrial and economic forecasts.
On the other hand, the bottom-up analysis starts with company’s analysis and forecasts and then industries then economy. To avoiding drawing the inconsistency assumption, macroeconomic factors must be analyzed first, hence top down approach makes more sense in real world. The building blocks for fundamental analysis is firms/ organizations audited and public financial statements. These publicly disclosed statement includes; Profit-loss statement, Balance sheet, Statement of profit distribution and Cash flow (L’Her et al., 2016).
In addition, ratio analysis plays a critical part in comparisons of different firms. This is because ratio analysis converts raw financial reports and data into a form that make sense and easy for investors consumption. The audited statements of companies financial performance includes: Balance Sheet, Profit/ loss Statement, Cash Flow Statement, Profitability statement. These statements are disclosed and published on public domain on quarterly and annual basis. All companies are required to do this by the law. The main financial ratios analyzed are profitability ratio, liquidity, debt, assets utilization, and market value ratios. These ratios measure a firm’s earnings, liabilities, obligations, assets utilization efficiency and market share.
Many investors apply results of ratios analysis to understand, examine and decide the most suitable stock to buy, sell or hold. After calculating all the financial ratios, the next step is to compare the ratio with that of the index benchmark. To come up with an appropriate benchmark, an investor needs to do an in-depth analysis of all the firms which are related in terms of size, structure, production and operational models. However, this approach is sometimes considered speculative and less reliable in moments when the entire industry or economy is struggling. Therefore, to effectively and optimally use rations in deciding whether a stock is worth buying, investors need to compare them with industry average as well.
After, ration analysis, the next phase of our investment strategy would be determining the true value of all the stocks worth buying. On this phase an investor can decide to use either one of the three valuation methods. These methods are income capitalization, multiples valuation and discounted dividend models.
Under income capitalization valuation method, the concept of future value and present value as applied in accounting and finance industry are the key contributors (Michaletz et al., 2018). As a result, shares valuations can be computed as the discounted value of all the expected future valuation of that share as shown below.
(i) 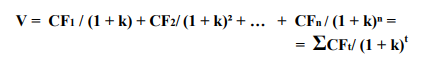
Where: CF is the expected future cash flow for an underlying stock and k is the discounting rate. The discounting rate is also known as the capitalization rate which is the investors required return rate capturing the risk levels.
Secondly, the discounted dividend approach considers price movements for stocks in relation to discounted dividends value, income capitalization, and risk adjusted returns. The dividend models assumes the only way wealth can be transferred from a company to investors is through dividends payments. Thus, the value of a common stock is computed as;
(ii) 
Where D1, 2, …, t is shares dividends distribution over period t.
The last phase of the strategy after all the analysis is deciding on all the assets that are in line with the investment goals and objectives. When deciding which stocks to buy, our group used the highlighted model. Letting P be the stock price and V the intrinsic value; we bought stocks if P < V since this implied the stock was undervalued. If P > V, we sold the stocks since they were overvalued. And if P = V, this implies the stock intrinsic value is at per with the market price and the investor should hold on to it (Prohaska et al., 2017).
The most practical approach applied by most analysts is the multiple valuation model which examines the Price Earning Ratio (PER) computed as;
PER = P / EPS, (iii)
Where P is the stocks market price, and EPS represents Earnings per Share. All the Data for prices and earning per share is available in public domain. To arrive at the best stock, an investor need to compare the Price Earnings ratio with the industry average. In addition, a distinction need to be made between normative PER (PER*) versus observed PER.
PER* = V/EPS0 (iv)
Where PER* is the normative PER, V is the stock intrinsic value and EPS0 is the last period’s earning per share. When investing in stocks; buy or keep more stocks if PER* > PER since at this time, the stock is undervalued. Furthermore, if PER* < PER, investor should sell the shares since they are overvalued and if PER* = Per, the market price and stock valuation are at same level.
In our case, there was a huge variation in PER across different firms. Since PER measure both profitability and growth of a company, the higher the PER the more profitable the company is and the higher the growth potential. The risk of a company decreases with decrease in PER and vice versa, hence a positive correlation between interest rates and PER.
Other than the above highlighted investment methodologies, we also used multiples alternatives such as Sales capitalization, equity value and market capitalization to determine the optimal portfolio and investment to make. Mostly, the multiples alternative were applied when earning were not representative of the actual value of stocks.
Security Selection
All the New Zealand Market trades we performed followed a structured blueprint to analyze, examine and select all the securities that would be profitable in our portfolio. All assets selections models used are presented in a simplified and investor friendly manner. The models capture all aspects of an ideal portfolio start with investment objectives, returns expectations, assets selection criterion, assets grouping and risk profiling, the overall trading experience and all the lessons we learnt during the exercise.
The goal number one for our investment portfolio was to realize a consistent return on investment of not less than 15%. Secondly, we anticipated our portfolio to outperform NZX 50 index by more than 2.5% based on the assets we selected and the analysis we did on each share. This success would be a reality due to in depth technical and fundamental analysis of all the assets in our portfolio. In our technical analysis we modelled and determined the volatility coefficient beta for each individual stock before a trade was opened. This was due to high volatility associated with stock markets. In addition to risk level determination of each share, the group estimated profit and earnings ratios for all the assets with a significance degree of confidence based on financial performance historical data analysis.
The group investment portfolio was made up of a combination of 15 securities. Securities are investment instruments/assets traded freely in an open transparent market. A market is considered transparent when relevant information about various asset classes is shared on public domain. All the securities and issuing companies are interdependent. The main goal of a portfolio is attaining maximum returns at a minimized risk which can be a challenge to realize using a single security.
In this section, we analyze and review our security selection process in depth. This is because, security selection is the basis for a profitable and a successful portfolio formation and management. We explain in detail why a particular stock is well suited under one portfolio instead of another. Most of the stocks are categorized as blue chips stocks, cyclical, income, defensive, speculative, growth and penny stocks.
The most popular of all stocks categorization is blue chip stocks since thy represent the most popular and best performing firms in the investment world. However, blue chips stocks definition is not well outlined due to changing in economic regime over a period of time. No company usually holds this position forever (Hanson and Kalthoff, 2018). This can be attributed to changes in science and innovation in the field of technology which automate business processes hence minimizing production costs while maximizing returns. Most common definition of blue chips companies are those that have a consistent history divided payment over time.
Income stocks are shares where earning are attributed to dividend cash flow instead of capital appreciation/ gain. Most investors use this approach to supplement other sources of income since it is reliable and less risky. Income stocks are from companies and organizations whose historical data show dividend payout of more than average year in year out. Mostly these companies involve large monopolistic firms such as electricity companies and telecommunication sector.
Thirdly, cyclical stocks are securities that grow in relation to the economy. The relationship between these stocks and the average growth of the economy is positive. When the economy is booming, these stocks are performing at their best and they’re so attractive to many of the investors. When the economy is at crises in period such as recessions, the decline in performance of these stocks is also noticeable with the same magnitude. The name cyclical is derived from the tendencies of these stocks to follow business cycles.
Cyclical stocks on the other hand act as defensive securities with a rare shift as a result of price movement. Due to this low volatility aspects, cyclical stocks have low returns hence less popular to speculators. These stocks are assigned to low risk stocks since they have low coefficient of correlation beta. In falling markets, stocks experience selling pressure but for defensive stocks, they withstand this pressure (Arbaa and Benzion, 2016). As a result, these stocks are best suited for long term investors. These stocks continue to sell and perform regardless of changes in micro and macro-economic aspects of an economy.
Our portfolio was made up of Equities (New Zealand Stocks), options and futures. To determine the amount to allocate and invest on each stock, we consider various factors about the underlying share and the financial health of the firm. These factors included our risk acceptance appetite, returns objectives and the analytical findings of technical and fundamental research. After modeling the future trend of each asset, we were able to determine the make a decision of assets to dispose, hold or buy by implementing our reliable assets selection strategy.
Minimization of portfolio risk and maximization of assets expected earnings was our top priority which we achieved through application of diversification theories as explained by Dennison, (2018). To compliment our stocks portfolio and increase returns potential, we invested in short term ETFs and funds. This strategy helped realize how importance assets allocation was to success and effectiveness of any given portfolio. Our finding was in line with the efficient m market hypothesis which states and explains how assets allocations exceeds assets selection in fueling any investment portfolio towards its success.
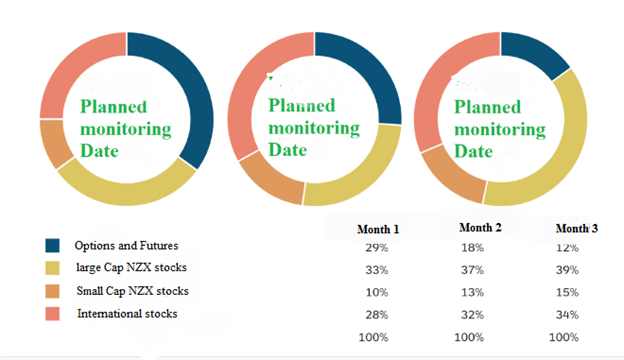
Figure 2. Monthly securities allocations
Through the strategy, the group was able to open short- and long-term trade with more confidence as highlighted in Figure 2 above. The only part, that gave consumed more time was model diagnostic to ensure reliability, consistency, verifiability and predictability. The model applied long- and short-term trading signals, news, and day trading strategies and methodologies. The model growth, risk and return parameters were predetermined and tested. The common risk adjusted methodology applied in model testing was the sharpe ratio that evaluated trading strategy effectiveness and performance as shown in figure 3 below.
Using New Zealand stock exchange index, we were able to estimate our portfolio volatility and risk levels in relation to expected returns benchmark. Doing to effectiveness of our model and over confidence, we were tempted at some point to divert from our initial investment goal and try new asset class. This worked against us and lost 5% of our portfolio earnings as a result. The significance reduction in our portfolio earnings confirmed how catastrophic deviation from investment goals and objectives can be within a short period of time and loss of money over the long-term positions.
Since our objective was to maximize earnings within the shortest period possible, we neglected investing in bonds which were stable, less volatile due to their low returns. Instead we invested in the high volatile stock market. Our groups investing approach was very aggressive and we bought shares across all major industries which were in line with our investment general objective. The aggressiveness was as a result of the drive and push to learn and earn as much as possible using the indicators and signals within the shortest period possible.
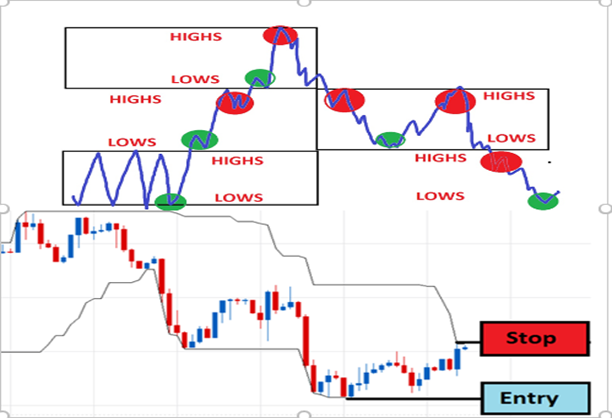
Figure 3. Stocks trading indicators
Risk Diversification
To reduce and keep systemic risk in check and control, portfolio diversification was necessary. Many scholars and researcher have documented the importance on diversification to any portfolio. We learnt the mistakes that most of newbie and starter investor make that cost them precious time and money. These mistakes are avoidable with the right understanding of financial markets and desire to learn financial education. To diversify and remain successful, investors need to have highest level of financial and risk management discipline. Most of these skills are not taught in class and experience was our best teacher, we learnt through making mistakes and improving on them. The power of diversification is magical and the performance of our portfolio was strongly correlated to how much diversified our stocks were. This was in agreement with a renowned investor and scholar Belderbos et al., (2020) who analysed how diversification minimize systemic risks and impact portfolio profitability across all markets.
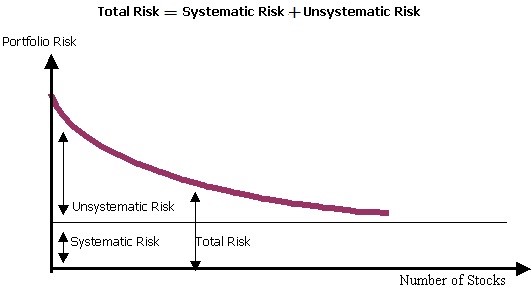
Figure 4. Portfolio systematic and unsystematic risk exposure curve
The two main techniques of diversification used were the random and objective diversification. Random diversification occur when securities are put in a portfolio at random. On the other hand, objective diversification determines the class in which assets will fall under based on investment goals and objectives.
Nevertheless, investors face systematic and diversifiable risk when investing. Systematic or market risk is is commonly caused by inflation, political stability, interest rates affecting every company in an economy. Diversifiable or unsystematic risk is experienced by specific industries and companies in an economy (Waemustafa and Sukri, 2016). The unsystematic risk can be minimized through diversification as shown below in table 1 below.
Table 1. portfolio diversification strategy
However, although diversification is beneficial to a portfolio through minimization of systematic risk, it has downsides. One of the downsides is, it is cumbersome and time consuming to manage very diverse assets in a portfolio. Since not investments cost the same, buying and selling diverse assets can be expensive to an investor portfolio. Thus, diversification cannot prevent loss but can minimize the impact of bad information or fraud on your investment.
Stock Selectivity :– skills/analysis
Since the beginning, our group members were enthusiastic and passionate about inveting and each and every member wanted to succeed and gain new skill. When the going got tough, we drew inspirations from our mentor who we nicknamed ‘Rich Dad’ and he owned and invested in many companies locally and internationally. His slogan was goal setting before opening any trade and having a plan B incase things don go as expected, this was a caution against loosing money which he called the rule number one of money, ‘Never lose money.’ The process of objective and goal setting was straight forward as it involved determining and differentiating asset classes by those for capital gains and the ones for cashflow. He insisted we should not loose hope and plan ourselves since tough times stayed longer once they hit the business in relation to good times. Good and profitable moments in the investment world are short lived which make the process hard, tedious frustrating and risky.
According to Tang (2018), 76% of investors lose money and end up broke more than they started. However, the few who master the skills of investment achieve massive success and are seen as lucky but when you scrutinize to the bottom line, it is all about discipline, persistency, determination, passion and desire to learn. Successful investors take all bad situation and treat them as opportunities to grow and rebuild the empires they lost.
The beauty part of the soft investment skills is, they are applicable across all markets, assets classes and all level of investors can benefit from these skills. Driven by all this and desire not to lose our money, we grew our initial capital of NZ$1,000,000 by investing in income and dividend paying stocks that generated consistent cashflow and return on investment over the period of investment. Cash flow is king and the we understood this, so we ensured we compounded our returns through our aggressive investment approach. The compounding principle worked well for undervalued stock that we bought low, held them and sold them at a higher rate. In regards to earning reinvestment, we only did this to assets and shares where the potential of growth exceeded our initial expected returns forecast.
Performance of the Portfolio (in terms of risk and return)
Over the period of the three months, we traded 15 shares and recording their daily. Most of the assets performed well and had high returns and were less volatile in comparison to our model forecast as shown in the figure below. This was attributed to diversification of assets which ensure non correlation of assets within the portfolio. Across all the trades we relied of the risk determinats (beta) in our model. When beta exceeded one, this implied the markets were more volatile than the individual stocks and vice versa when beta is less than one. Through analysis and examination of coefficient beta, we identified undervalued stocks in our portfolio and bought more of them while selling those which were not good match to our goal.
The ration of volatility to earning ratio was also a great indicator since it varied in effectiveness depending with the industry and the policies set by authorities within that sector. Most of our stocks were quality stocks since we based our selection on international stocks rating standards. We only considered stocks with S&P rating of above B+.
In regard to debt to assets ratio, our stocks performed well since we avoided companies which had huge long term debts and unstable trading an operational business models. Most of the firms had a debt ration less than 1.1 which meant they were healthy. Bad firms had a debt ot asset ration greater than 1.1 which was a red flag. This is because, incase of a recession or other economic hurting event, a company with debt to asset ration greater than 1.1 would never recover despite many efforts and input from the governments and authorities.
The other aspects we used to examine our stocks was earnings per share. We determined this by analyzing the price book value for companies we invested in and ensured we only invested in firms whose price to book value did not exceed 1.2. To compute the ratio, we dividend the average price of a stock with its book value and get the true value of the stock. Stocks selling less than their book value performed better than those selling more.
Figure 5. Securities returns versus risk performance
Most of the stocks we traded in performed as we modeled above hence enabling us achieve our investment objectives within a short period of time and a reduced cost. Our top performing stocks were SPK, ZEL, WHS, NSAIR, NZX, FBU.NZ, ANZ.NZ, CEN.NZ, KMD, KPG. KMD earned the highest growth at 24.2% with a low volatility of 7%. The growth of Kathmandu Holdings Limited was as a result of good management practices and product innovativeness. Air New Zealand Limited also had a remarkable growth of 21.9% with a standard deviation of 17%. The focus to low tier cities and improvement of customer service was the main factor that led to this growth.
Business, cost, prospects, products prices, returns on investment and financial position of our portfolio was highly affected by risks described below. The main risk that every investor considers is the financial risk (Bigio and d’Avernas, 2019). This risk evaluates debt levels of a company to conclude its financial health. The main ratio that determines a company overall risk includes; debt to equity and capital ratios. A lower ratio shows that a company is healthy financially and it is financing projects using its own resources rather than debt. Though, Fletcher building Limited (FBU.NZ) balance sheet is still strong, its debt to capital and equity ratios deteriorated for the fiscal years 2017 and 2018. Therefore, FBU.NZ debt use is risky. The main risk that FBU.NZ face and has led to $7.2 billion in the lawsuit with its rival competitor Brickworks Limited over defense contract loss. In addition, increase in complexity of buildings designs and structures has led to a significant increment in cost of development from sourcing of raw materials to the skilled labor employed to execute the project. Fletcher building Limited (FBU.NZ) stated that it needed to sell 1,000,001,000 building material supplies to breakeven. This risk emerges mostly from the firm’s structure and production process.
Our portfolio risk profile has been changing over the period of investment in different ways due to changes in policies of companies we invested in. For example, Air New Zealand Limited (NS) used to focus on deals, but now it is making a transition to market focused company. This transition has a great impact in changing perceptions of Air New Zealand Limited (NS)’s consumers all over the world. To achieve this, the firm has developed a restructuring strategy that concentrate and strengthen the key main pillars of this industry. These pillars include; supply chain, operation, globalization, customer, marketing, partnership, new products innovation and customer satisfaction. Air New Zealand Limited (NS) has a team of supplies who supply different parts required for various projects. To cut down cost, the CEO suggested Air New Zealand Limited (NS) to open its spare manufacturing plant, a move that investors has supported. Since NS customers are specific and unreachable through traditional ads, a new strategy was launched by entering into contracts with potential clients and explain potential value of any new project. As a result, the company has as well been able to effectively revolutionize the shopping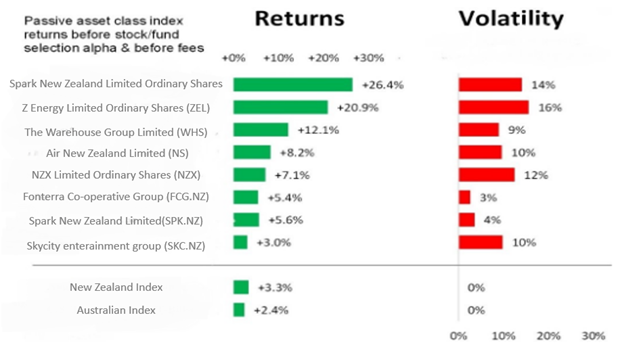
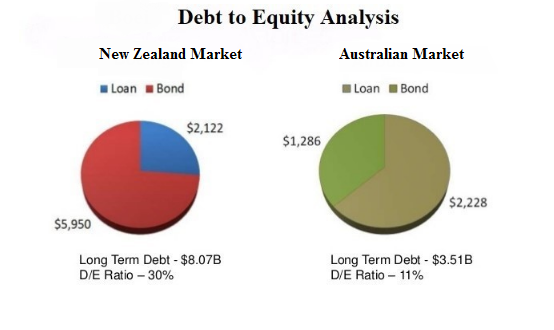
In addition, New Zealand investment performance profile has been positive and return on investment outperformed the industry at 3085.55% as of 2020. Some factors affecting this healthy and positive growth are; sustainable positive earnings, impressive valuation, innovative products and strategic partnerships. As an investor, New Zealand stock market should be part of your best portfolio. Investing on New Zealand stocks have generated a positive return on share of 8.91% to date. The industry returns are at 6.57%. Therefore, New Zealand 50 index investments outperformed the market by almost 33%. A big proportion of the market’s performance is as a result of good management and strategic decision making by key stakeholders within the company. The management supported product diversification, partnership and marketing through creating public awareness of the brand. This have aided and resulted to a significant sustainable growth in revenue. As we saw in the ratio analysis, the debt to equity ratio has been increasing for New Zealand market meaning its financial status health is at risk hence higher risk to equity. This ratio measures how well an economy leverage finance in terms of relations between its equity and long term debt. As of 15th May 2020, New Zealands Debt to Equity ratio stood at -5.33. Shareholders equity stood at $0.41 Billion as of 2020 with a debt of $10.66 Billion. This is riskier since the debt increased in comparison to $9.78 Billion debt and $1.71 Billion equity in 2019. Thus, the market’s debt is riskier and its cost is relatively high as shown in Figure 6 below.
Figure 6. Debt to Equity ratio analysis
Our portfolio cost of capital was 9.1% as of 15th May 2020. Hence the Weighted Average Cost of capital for WACC was 9.1%. The company’s financial statements provided TTM data that was used to compute Return on Invested Capital which stood at 67.04%. On average the Weighted Average Cost of Capital (WACC%) increased by 9% from 9.71 in the year ended 2018 to 10.63 in the year ended 2019. To raise capital, it cost money hence companies should match their Return on Invested capital (ROIC%) to Weighted Average Cost of Capital (WACC%).
Figure 7. Our group portfolio performance trends
Lessons Learnt
One of the great lessons we have learnt is investing is not that complicated and anyone with the right financial education can achieve success by having the right model and strategy. Many peoples are scared of investing by the deep vocabularies and they quite even before trying.
Investing is all about the right mindset, attitude, discipline and desire to succeed. Sometimes the market is can frustrate you, but if you hold on to your goals and stay focused, you’ll succeed. Timing is so important in investment world since opportunity windows are short lived and the few who are prepared when the opportunity show up are the ones that ripe the biggest.
Finally, we learnt number never lie and if you listen to them and do as they say, you can never go wrong. Succes or failure of any portfolio is 100% due to investors reaction and emotional imbalance. When investing, we should base our decisons on logic and facts instead of emotions, feeling and speculations.
What we could have done better
In conclusion, we believe we can do better by combining stocks with bonds in our portfolio. This would minimize risk while maximize returns. By focusing on small companies than large companies we would have provided higher returns. Smaller companies are riskier but tend to be more profitable in many cases due to reduced overheads and cost of goods sold. Proper diversification would have created an efficient portfolio with minimized risk and high expected returns.