


Abstract
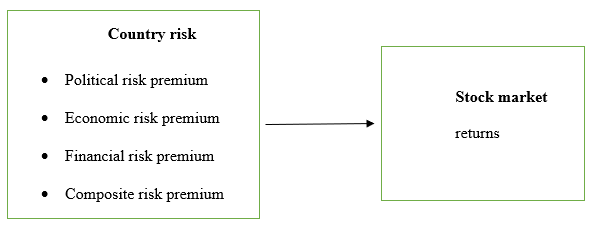
The increased globalization highlights the researchers to study and understand the country risk and its components, economic risk (ER), financial risk (FR), political risk (PR) and how they affect stock market returns. This study is organized to fulfil this need. The impact of country risk on stock market returns of Pakistan over the time period of 7 years from 2010 to 2017 is estimated. Using the unit root test for panel data, the stationary of the data is checked. Then correlation test is applied to check the issues of multi collinearity among variables. Finally, pooled regression analysis is used. The empirical results show significant relationship between country risk, its components, and stock market returns.
Keywords: Country risk, ICRG standards, stock returns, Political risk, Financial risk, Economic risk

Chapter 1
Introduction
This chapter starts with the introduction of the topic. Later problem statement is identified. Then research questions, objective, and significance of the study is explained.
1.1 Introduction
The external debt crisis faced by the developing countries, over the last few decades has given signals to the borrowers and creditors to worry about their investments in those countries (Gür, 2001). The Asian crisis increased the demand of private loans by developing countries and creditors are now concerned about the repaying ability of debt on time, and this ultimately increased the demand for credit rating agencies and sovereign ratings (Iranzo & Silvia, 2008). Sovereign ratings or country risk assessment will benefit the creditors if they forecast the debt crises precisely in advance (Iranzo & Silvia, 2008). The increased globalization highlights the researchers to study and understand the country risk and its components, economic risk (ER), financial risk (FR), political risk (PR) and how they affect stock market returns. Selecting country with regionally and globally diversified portfolios and evaluating the direct investment is important ( Hassan, K. M., Maroney, N. C., El-Sady, H. M., & Telfah, A., 2003)
Country risk is generally risk associated to international businesses, explaining the cumulative situation and effects of risk (Mihaela & Alina, 2011). Country risk regulates the ability and willingness of a country to pay interest that is scheduled, on the external debt (Timurlenk & Kaptan, 2012). The analysis of country risk determines the borrowing country’s economic and political factors that may affect the principal and interest repayment on time (Timurlenk & Kaptan, 2012).
Taking in account the situation of Pakistan, it is considered as emerging economy (IMF Report, 2016). The political situation of Pakistan remained insubstantial over the last few decades. The Pakistani government is facing security problems. Al Qaida groups, and Haqqani Network, and tehreek-e-Taliban were responsible for suicide bomb attacks, terrorism, target killing and now the situation was controlled by launching operation Zarb-e-Azb in FATA[1] (Hamza, 2017). Corruption scandal on main governing bodies like former Prime Minister Nawaz Sharif and his family disqualified as their names appear in PANAMA leaks[2] (GEO News, 2018), Dr Asim[3] who was the former advisor of PM during PPP government was disqualified due to 17 billion corruption case (Pakistan today, 2018), former Chief Minister Punjab Muhammad Shabaz Sharif is facing the corruption regarding Ashiana Housing scheme, clean water cases, and Punjab Power Development Company (The Nations, 2018). Sharjeel Memon and 11 others accused in corruption case as they charged exorbitant rates in advertisement awareness campaign by using power (Dawn news, 2018. The edgy relationship with countries sharing border with Pakistan (India and Afghanistan). A report issued by A.M. Best Rating Service[4] ranked Pakistan 5 on country risk tier scale in 2018 that means Pakistan as a country is facing very high political risk. Financial risk along with Economic risk is also high on scale. According to this report, Pakistan imports oil and in recent years has profited from the lower goods prices. In 2017, the Real GDP growth speeded up to 5.3%, resulted from the developments in macroeconomic stability. Much can be done for the betterment of education system. Pakistan lags the area regarding human advancement indicators.
Economic Risk: High
Pakistan’s economy is ruled by the services business that represents 60% of the Pakistan’s GDP and agriculture representing 25%. (World Bank, 2018). The agricultural output has been agonistically affected by extreme climate conditions. Poverty and social issues for example poor sanitation system, lack of education, and exposure to cataclysmic events remain main concerns (World Bank, 2018). The working conditions of Pakistan’s keeps economic development below its potential. Water and energy deficiencies is a key blockage for enhancing economic development and growth, especially in manufacturing division. Extensive load shedding of almost 12 hours a day left companies and households deprived of power (CRT, 2018). In 2017 public debt was 68.1% of GDP amounting a huge figure, impaired by ineffective management of fiscal policy. The China-Pakistan Economic Corridor (CPEC) is benefitting Pakistan’s economy (CRT, 2018). The country’s geo-strategic location benefits trades also. The populace is exceptionally youthful and labor costs in Pakistan are low, this could help to improve economic competitiveness.
Political Risk: Very High
The improving relations between civil government and military chief has reduced political instability. But there are some dispute still not figured out that stay between them that could turn out to be unstable. The ruling party’s political future could be intensely reliant upon its capability to reduce the power shortages before 2018’s election. Terrorism, internal conflicts and social unrest are major security risks (World Bank, 2018). This limits institutional and governance efficiency. Massive tax avoidance is one of the primary difficulties for increasing fiscal revenue and reducing dependence upon foreign aid. As indicated by the Organisation for Economic Cooperation and Development, income tax in Pakistan is paid by approximately 1.0% populace. 17.5% growth is observed in Tax revenues as compared to last year, estimated by Federal Board of Revenue (FBR). PKR1,992 billion in jan-july 2018 compared to PKR1,696 billion last year (World Bank, 2018). Corruption stays inescapable, high level of corruption is seen in politics and Pakistan has been ranked 117 out of 176 countries in Transparency International’s 2017 Corruption Perceptions Index. Religious and political parties are expected to continue protests and can end up violent.
Financial Risk: Very High
Initiatives to combat money laundering and terrorism financing could be further improved. The foreign exchange rate should be made more adaptable, to strengthen external support and increase competitiveness (CRT, 2018). The low inflation rates led the central bank to reduce its policy interest rate to its lowest level in over forty years. Average inflation for Jul-Feb 2018 remained 3.8 percent compared to 3.9 percent in Jul-Feb 2017, well below the target of 6 percent for 2018 (world bank, 2018). In January 2018, official international reserves declined to US$12.2 billion by mid-march 2018, compared to US$16.1 billion at end-June 2017. (World Bank, 2018). Macroeconomic stability must be reached through structural reforms, according to the IMF. The IMF also recommends enhancing financial inclusion to drive growth, particularly for women, low-income citizens, and rural populations.
The World Bank’s Ease of doing business index ranking show countries against each other in view of how the regulatory environment is helpful and suitable for business activity more grounded assurance of property rights. Countries ranked from 1 to 20 have less complex and all the more well-disposed controls for businesses. Survey in 2017 was conducted by World Bank’s doing business annual rating has classified Pakistan 147 out of 190 economies showing that difficult and unfriendly regulations for doing business. All these factors affect the investors’ decision of investing in Pakistan.
With Increased globalization, the understanding of country risk and stock market returns is important for selection of country with diversified portfolios. Stock market index is not only the indicator of stock markets’ performance but it is also indicates the country’s economic activities and performance. Karachi stock exchange was founded in 1947 and it is the Pakistan’s biggest liquid exchange, lately in 2016 its name changed to Pakistan Stock Exchange Limited (PSX). PSX provides opportunity to local and foreign investors to trade in secondary market. Volatility of stock market is important to policy makers, researchers, and portfolio administrators while focusing on health of company and investment prospects in future (Rapach & Zhou, 2013).
Stock market returns and its volatilities are linked with uncertainty and ambiguities, and it is the key indicators of portfolio management decisions and capital budgeting for practitioners in finance. Financial strength of a company and future prospects are affected by these two factors. (Poon & Granger, 2003). The increased international flow of money after eradication of capital control has diverted the concentration towards Stock market, particularly during the 1980s. Ever since, stock market is centre of attention due to increased globally diversified businesses and international money flow. The certainty of stock market movements pertains concept of market effectiveness and efficiency, this helps construction of accurate CAPM (Rapach & Zhou, 2013).
1.2 Problem Statement
Emerging markets demonstrate high level of economic growth and they often face more political uncertainty and their economies are prone to booms and busts due to rapid growth and industrialization. Pakistan is considered as an emerging market [5](IMF, 2016). According to the ICRG standards, Country risk comprise of ER premium, FR premium, PR premium and a composite risk premium of the particular country (The PRS group, 1979). Country risk of Pakistan should be measured as investors consider the political uncertainties, financial developments, and economic changes, while making an investment decision. They also consider the unexpected changes in political environment that could adversely affect their investment in such economies. In existing literature, very limited studies explore the relationship between country risk and stock market returns especially using ICRG standards. So, this study would be conducted to solely find the impact of country risk on the returns of stock market particularly in context of Pakistan.
1.3 Research questions
The research questions for this study will be:
- How the economic risk will effect stock returns of companies listed on PSX?
- How the political risk will effect stock returns of companies listed on PSX?
- How the financial risk will effect stock returns of companies listed on PSX?
- How country risk will effect stock returns of companies listed on PSX?
1.4 Objectives
The objective of this study is to find how economic, political, financial and composite country risk effect the companies listed on PSX. The impact of every individual component of country risk on stock returns will be measured.
1.5 Significance
To be successful in business world, the experts and specialist consider that adjusting and adapting to the external environment as an important indicator, and it is substantially simpler to attain when risks effecting the business are known (Mihaela & Alina, 2011). The business strategies can be modified to achieve profitability and remain invulnerable if degree of risks and its factors are forecasted timely and accurately. As we know that economic activities directly affect the political and social atmosphere, therefore, analysts and the related parties put emphasis on country risk (Mihaela & Alina, 2011). The reason is obvious, as businesses are now expanding across borders and investors are investing in diversified portfolios. This requires identification, assessment and analysis of worldwide risk that the investors would face in that particular country.
As previous studies, Hassan et al. (2003), Heinrichs and Stanoeva (2012), Nazir, M. S., Younus, H., Kaleem, A., & Anwar, Z. (2014), Suleman, T., Gupta, R., and Balcilar, M. (2017), Steiger (2016), Kara and Karabiyik (2015), Omer and Sun (2015), and Ahmed (2017) show that high Country risk results in unexpected investment losses.
A very limited literature exists on this topic particularly on Pakistan using ICRG standards. Erb, C. B., Harvey, C. R., and Viskanta, T. E. (1996) have used time series cross-sectional analysis. Hassan et al. (2003), used descriptive statistics and GARCH-M (1, 1) model. Suleman et al. (2017) used k-th order nonparametric approach on time series data.
None of the study found the impact of country risk using ICRG standards on stock market of Pakistan. This study use the panel unit root and pooled ordinary least square regression model on yearly data over the period of 2010 to 2016. The limited evidence about studies on Pakistan using panel data test, gives a good reason to conduct this research. Each component of composite risk will be studied individually to see the impact on stock returns. This research will help investors and financers to choose the Pakistan on the basis of riskiness.
1.6 Organization of the study
The study is organized in five chapters. The chapter 1 provides an introduction of country risk and stock market return following the research questions, problem statement, objectives, and significance of the study. In the next chapter, previous work and literature on dividend decisions will be presented. The Chapter 2 explains literature review, hypothesis generated from literature, and theoretical framework. Chapter 3 outlines the data collection and sampling techniques, detail of variables and panel data analysis test used to research the hypotheses. Chapter 4 provide the descriptive statistics, correlation, followed by panel unit root and regression analysis. EViews (10) software is used. This chapter will explain will explain results in detail. Finally, chapter 5 concludes the paper. Recommendations as well as implication is also part of this chapter.
Chapter 2
Literature Review
This chapter covers the literature review, hypothesis, and theoretical framework. Many articles in the literature review identified the relationship between country risk and stock returns but very few articles were available on Pakistan using ICRG standards.
2.1 Literature Review
The literature on country risk and its components, and stock market was collected by going through many articles. The literature review helps in the construction of hypothesis.
2.1.1 Country risk and stock market
Due to globalization and crises experienced by the countries, stock returns volatility shows that higher level of risk experienced by the investors creates a sense of insecurity for the future investments. The study on the country risk is beneficial to determine the importance and attractiveness of economies and their competitiveness in market. Erb et al. (1995) conducted a research mainly to examine the effect of country risk on stock returns. Their credit rating source for a country was semi-annual survey of bankers. The outcome of this study suggested that countries with lower credit risk were related to have lower expected returns from investment. The second aspect of their study explained that country’s credit ratings could provide a mean to rank countries on the basis of low and high expected returns of these countries. Another research was conducted by Erb et al. (1996) have addressed five measures. Three includes ER, FR, and PR using the ICRG ratings. Fourth was composite risk that was aggregated value of them. And the last was institutional investors in country credit ratings. They basically tried to find that whether any of these measures could provide information about expected future stock returns. They have used time series cross-sectional analysis. The results suggested that returns and country-risk were correlated.
Bailey & Chung (1995) conducted a study with a purpose to explore how exchange rate fluctuations and political risk effect stock prices of companies from one country. They used a multifactor model and measured the level to which disclosure to these factors described returns of individual stocks and portfolios. The unconditional premiums for risks were measured and no sign of unconditional premium for currency and political risks were found. Results showed a significant relationship between equity market premiums for risks and debt market and currency premiums.
Kwona & Shinb (1999) conducted a research to identify the impact of economic activities on stock returns in Korea and the stock market prices response to changes in macroeconomic activities are under observation. The macroeconomic variables consisted of the trade balance (TRB), foreign exchange (EXCH), industrial production (PI), and M1. The data used for macroeconomic variables showed that the stock market was monthly based i.e. (January 1980–December 1992). To identify the causal relationship among the variables, they have used the granger Causality Test. Vector error correction model (VECM) found that variables were co-integrated and there exist a direct and long run relationship among macro-economic variables and stock returns and equilibrium with each other.
The study conducted by Hsing (2008) used extended open macroeconomic model to examine exchange rate movements for Singapore (Singapore Dollar) against the US dollar. The variables were Real quantity of money, the stock market index, government deficit spending, and country risk. Their findings depicted that exchange rate for Singapore was positively related with real stock index, amount of foreign exchange, and world output. And the exchange rate was negatively affected by country risk, real quantity of money, and because of interest’s rate since the Asian financial crisis.
Ali, T. M., Mahmood, M. T., and Bashir, T. (2015) conducted a research with a purpose to find the effect of variables on movements of exchange rate in Pakistan. The variables include money supply, inflation and interest rate. The research was conducted to identify the relationship between variables; short term and long term. They have collected the data (July-2000 to June-2009) on monthly basis and applied the following tests including Granger Causality Test, VECM, and Johansen Co-Integration Test. These tests was used to determine effect of variables on each other. There exist a positive relationship between inflation and exchange rate movement and they had long run relationship between them. The other two variables, money supply and interest rate were negatively related with exchange rate.
Another study was carried out by Hassan et al. (2003) for evaluation of foreign direct investments and decision of state’s selection with in this globalized world. Country risk, political risk and economic risk all were kept in view for better understanding and their main impact on stock market returns was important regionally and globally for diversified portfolios. Likewise, predictability and volatility plays fundamental role for FDI’S and state’s selection internationally as well as regionally. Researcher collected data from 10 African and Central Asian countries over the time period of 1984-1999, in which quantitative measures of the country’s risk rating were used published in ICRG. Descriptive statistics of each country was identified and GARCH-M (1,1) model was used. Their results showed that country risk significantly affects return estimations and stock market fluctuations. Results were consistent with the previous literature. And the results were interpreted cautiously as five out of 10 countries had data of only 3 years.
Research conducted by Suleman et al. (2017) used k-th order nonparametric approach. They have used ICRG rating to find the impact of country risk on stock market returns of 83 countries including Pakistan. Out of 83 countries, 50 percent countries results showed that country risk have an impact on the stock market returns and movements in the stock returns. Only one case depicted that country risk doesn’t predict the stock returns. The results also showed that composite risk and its components (ER, FR, and PR) were strongly predicting returns and volatility. Developing countries including Pakistan have high political risk and considered as risky countries in the context of political risk.
Suriani (2015) has selected Pakistan and tried to identify the connection between the exchange market and stock prices. KSE-100 index was used for stock prices. Pakistani Rupee (RS.) against US Dollar ($) was taken for exposure of exchange rate. He used the monthly data (January 2004 to December 2009). The result showed that exchange rate, stock price had no particular relationship, and both were independent of each other.
A study conducted by Kara and Karabiyik (2015) with a purpose to find the whether the country risk affect the stock returns. The time period ranges from 1999 to 2013 and the stock prices of Bosra Istanbul was used. They have used Johansen Co-integration Test and VECM model. The findings of research showed that country risk and stock prices have causal relationship. There was a short-term and long-term causality. They have analysed that decrease in country risk premium leads to increase in prices of stocks.
Another study was conducted by Umar & Sun (2015) in order to find out the relationship between stock prices, Country risk, and ER of the Renminbi. The methodology used by them was extended open macroeconomic model and descriptive statistics analysis. Furthermore, another Newey-West method was employed too and their result estimation was used beneficially for the standard errors as well as for covariance when both autocorrelation plus heteroscedasticity forms were unknown. The results showed that country risk is caused by exchange rate. The stock market of China has also granger caused exchange rate. The results of study showed that stock market affect the country risk but not vice versa. The relationship can be explained as unidirectional. Therefore, the exchange rate and stock prices both explained the variation in country risk. Exchange rate and country risk did not explained the variation in stock market index.
On the basis of above discussion, country risk an. Therefore the following hypothesis is proposed:
H1: Country risk has impact on stock returns
2.1.2 Financial Risk and Stock market
Kumar and Dhankar (2017) have conducted a research on financial uncertainty, financial integration, and stock markets instability of South Asian countries. These economies’ advancement has led to the various opportunities for investors. This has attracted the foreign investors and more of the foreign institutions are ready to invest. Ljung-box statistics questioned the unsystematic movement of stock returns. These statistics highlighted the significant auto correlations in the returns. Current stock prices are free of the past and available information related to these stocks. On this basis, the influence of previous time period decisions on current investments can be inferred. The latest research by (Singhania & Prakash, 2014) found the same non-linearity and variations in returns as per the past researches. Fewer studies in the past have focused on regional integration when the spill over influence of international financial uncertainty was tested (Singhania & Prakash, 2014). The study predicted a variation in volatility in the international market. The influence has been tested on the instability of the stock market in question. As a result, this study reported the significant integration of the Indian stock exchanges with the international capital market and responded to global events that significantly affect investment decisions in the same decision.
Al-Rjoub and Azzam (2012) conducted a study. The objective of this paper was to determine the behaviour of emerging financial crisis and their impact on stock returns of Jordan from 1992-2009. The study not only identified “crashing” periods of significant price reductions, also investigated the behavior of stock prices during these formations to achieve the desired results. The study took the historical crashes in ASE and their aftermath for the last 18 years and from this data they have determined the behaviour and volatility of stock returns. The global, regional and local events were considered during this study. To complete this study, GARCH-M model was used. This model captured the changes in variance. The closing prices of ASE index at monthly, weekly and daily basis were thoroughly analyzed. The crisis specification defines the fall in the stock market as 20 percent, and the one adopted by Patel and Sarker, 35% or more decline in the stock market. Stock market crash. The third scenario, which takes into account the time period of the 2008-2009 crisis. It was considered to accurately examine the stock market rate for a given period. The results showed that crises has negative effect on stock returns and banking sector prevailed by remaining powerful. The effect of the 2008-2009 collapse, including the biggest decline in stock prices and high volatility, is the most severe impact. In this article, especially before and after the crisis, the volatility between stock returns and volatility and a strong reversal of high persistence are presented.
Arora and Ratnasiri (2014) has examined the US developed market and the emerging Asian stock markets from an international portfolio diversification perspective before and after the global financial crisis. The study used the Morgan Stanley Composite Index (MSCI) data. The co-integration test was applied and the research period was from 1992 to 2014. The findings showed the existence of a strong integration in the long run.
The literature on financial risk and stock return shows that both variables influence each other. So, this hypothesis is concluded:
H2: Financial risk premium has impact on stock returns
2.1.3 Economic Risk and Stock market
Laichena, K. E. and Obwogi, T. N. (2015) selected east African countries and tried to examine the effects of macroeconomic variables on stock returns. The effects of interest rates, exchange rate, GDP, and inflation on stock returns was measured over the period of 2005 to 2014. 3 East African countries were taken as a sample (Kenya, Tanzania and Uganda). This study applied descriptive statistics and panel data regression analysis. The results showed significant relationship between the macroeconomic variables and stock returns.
A study conducted by Gay (2016) explained the relationship between macro-economic variables of oil prices and exchange rate for BRIC and the stock market index prices. The time series relationship among variables has been investigated. Bos jenkin ARIMA model was used. The results showed insignificant relationship among variables. Stock market returns for present and past also showed insignificant relationship entailing that market efficiency of BRIC counties was weak.
Ouma and Muriu (2014) investigated the impact of the macroeconomic variables on stock returns in Kenya. The Arbitrage Pricing Theory (APT) and CAPM was used. The study has used monthly data over from 2003 to 2013. The unit root test was applied and the results depicted that data is stationary at level. The OLS technique was also applied. The results showed a significant relation between returns and macroeconomic variables.
The above studies show that macro-economic variables has impact on stock market returns. Hence, following hypothesis is proposed:
H3: Economic risk premium has impact on stock returns
2.1.4 Political risk and Stock market
Ahmed (2017) conducted a research to find the impact of political regime on stock market. This study explained that over the short time period of four years; Egypt has confronted political shifts including the downfall of dictator, military revolt, and two presidential elections. This study analysed how such events effect the behavior of equity market in relation with risk and return. The dataset taken for this study comprised of closing prices (daily) of market. An event study approach was applied to find the impact of events on sectors and market returns. VAR-EGARCH model was also employed to find the extent to which these volatilities react to these events. The results suggested that political instability and uncertainty has a thoughtful effect on the returns and volatilities of all sectors, but the intensity is different for every sector. The price and instability effects were most prominent in banks whereas materials and construction sectors were least responsive to these events. The military coup (2013) turned out to be the most pervasive event affecting the sector-specific indices and stock market.
An investigation directed by Dimic, N., Orlov, V., and Piljak, V. (2015) tried to explain how stock market returns of frontier, developed, and markets are affected by political risk. The sample consisted of 64 nations and an unbalanced panel dataset was utilized. The time period selected was from 1990 to 2013. ICRG was used for political risk data collection. Fixed-effect panel regression model was estimated. The results showed that political risk is positive and highly significant proposing that lower political risk leading to higher stock returns. The impact of individual components was different based on the type of market. The political risk component that was significant in three types of market was government action and the difference was observed in ethnic tensions.
An investigation led by Nazir et al. (2014) on impact of political occasions on securities exchange returns in context of Pakistan. The motivation behind this examination was to explore the connection between PSX and questionable political occasions from 1999 to 2011 utilizing the mean-balanced return model and occasion contemplate strategy and by looking at the market proficiency. Two government styles were studied, i.e. autocratic and democratic. The outcome demonstrated that these occasions affect the PSX returns. Also, the outcomes sought PSX is wasteful for limited ability to focus time, following 15 days PSX consumed boisterous data. The political circumstances were steadier in autocratic government structure than in just structure however expressing that securities exchanges are more productive in autocracy is hard on the grounds that exclusive couple of occasions occurred during an authoritative administration and size of occasions was not same in the autocratic and majority rule government structure.
Chau, F., Deesomsak, R., and Wang, J. (2013) has inspected the effect of political vulnerability (caused in the Arab World i.e., “Middle Easterner Spring”) on the instability of securities exchanges in the (Middle East and North Africa) MENA locale. By Utilizing multivariate GARCH demonstrating system, they have inspected the effect of political occasions on securities exchange unpredictability in MENA nations. To start with, customary and Islamic securities exchange records responded heterogeneously to the ongoing political strife. A notable increase in the volatility of Islamic lists during political unrests while the uprisings have had next to zero critical impact on the instability in customary markets have been observed. Such difference is confirmed by multivariate GARCH. Second, paying little mind to its effect on unpredictability, there was a little proof to propose that MENA markets have turned out to be more coordinated with global markets after the political turmoil. Third, comparative outcomes for benchmark lists were not found, which indicates that the progressions are the consequence of political strains. As a rule, these outcomes are hearty to show determination and steady with the thought that political vulnerability adds to money related unpredictability. The discoveries are vital in understanding the part of political vulnerability on securities exchange steadiness and are of noteworthiness to speculators and market controllers.
The existing literature on Political risk and stock market shows that political risk has impact on stock market. Therefore, this study has deduced following hypothesis.
H4: Political risk premium has impact on stock returns
2.2 Hypothesis
Four hypothesis are developed for this study to achieve the objectives of the research.
H0: Country risk has no impact on stock returns
H1: Country risk has impact on stock returns
H0: Financial risk premium has no impact on stock returns
H2: Financial risk premium has impact on stock returns
H0: Economic risk premium has no impact on stock returns
H3: Economic risk premium has impact on stock returns
H0: Political risk premium has no impact on stock returns
H4: Political risk premium has impact on stock returns
2.3 Theoretical framework
Chapter 3
Research Methodology
This chapter includes purpose of the study, data collection techniques, explanation of dependent and independent variables of the study. The sample size, methodology, and data analysis techniques are also explained in this chapter.
3.1 Purpose of the study
The purpose of this research is hypothesis testing. The data used for this research is Panel data. A short panel has large number of entities but a small number of time periods and a long panel has large number of time periods but small number of entities (Cameron & Trivedi, 2009). When same entities are observed for each period of time then panel is called as fixed panel (Greene, 2008). Therefore, Fixed and short panel data is used in this research. The nature of research is empirical therefore quantitative techniques are used.
3.2 Population
For this research, Pakistan stock exchange is selected as a dependent variable. The total companies listed on PSX are 559 and distributed in 35 sectors (PSX website[6]). Therefore, population is 559 companies.
3.3 Sample size and sampling technique
100 companies have been selected from the PSX to get the more accurate and reliable results. Convenience sampling technique has been used as complete data of all companies is not available. Laichena, K. E. and Obwogi, T. N. (2015) used convenience sampling technique to check the impact of macro-economic variables on stock returns. So companies with complete data over the period of 2010 to 2016 are selected from every sector.
3.4 Definition and measurement of variables
The dependent variable for this study is stock market of Pakistan.
The independent variable is CPFER and its three components FR, PR, and ER. The International Country Risk Guide (ICRG) provided these 22 different factors on the basis of which country risk can be measured. So, we will use the whole 22 factors for this research.
CPFER = Composite political, financial and economic risk ratings
PR = Total political risk
FR = Total financial risk
ER = Total economic risk
| Independent variables | ||
| Economic risk | Financial Risk | Political Risk |
| · Real GDP growth rate | · External debt to GDP | · Government stability |
| · Annual inflation rate | · Exchange rate stability | · Corruption |
| · GDP per capita | · Current account to exports | · Military’s political influence |
| · Budget balance to GDP | · External debt service to exports | · External conflicts |
| · Current account to GDP | · Net international liquidity | · Bureaucracy quality |
| · Laws and regulations | ||
| · Ethnic tensions | ||
| · Religious tensions | ||
| · Investment profile | ||
| · Internal conflicts | ||
| · Democratic accountability | ||
| · Socio economic conditions |
3.5 ICRG Methodology
In 1980, the ICRG rating model was created by managing editor of global reports. It consists of three main variables ER, PR, FR and they are further sub-categorised into 22 variables as a separate index. This statistical model calculates risks and analyses it. This model helps users to make their risk assessments. This tool is used by bankers, importers and exporters, FX traders, multinational organizations, investors, and other concerning parties. This model is used to determine how ER, PR, FR might affect investments and businesses today and in future. Users can make risk assessments based on the ICRG model on their own and they can modify it to fulfill their specific requirements. ER and FR indexes are established on 50 points and 5 sub components for each. PR index is made up of 100 points and 12 sub-components. The three indices total points are multiplied by 0.5 to yield the weights for CPFER. The total range is from 0 points to 100 points and subdivided into very low risk (80 points to 100 points) and very high risk (0 points to 49.9 points). We can conclude that, higher the rating calculated for the ER, PR, FR or CPFER, the risk will be lower, and lower the rating calculated for the components, the risk will be higher. Erb, et al. (1996), Hassan et al. (2003), and Suleman et al. (2017) used this methodology to find the impact of country risk on stock market returns.
3 5.1 Economic risk rating
It evaluates the economic qualities and shortcoming of a country. The base number doled out to each component is zero point and maximum rating relies upon the fixed weight of that component. In each situation:
When the risk point total are lower, the risk is higher.
When the risk point total are higher, the risk is lower.
Stegier (2016), Suleman er al. (2017) used economic risk rating along with other components of country risk.
GDP per Head
The GDP per head for a particular year is stated as percentage of average of total GDP.
Real GDP Growth
Annual change in the GDP is stated as a percentage.
Inflation Rate
Rate at which the level of prices of commodities rise, thereby lowering the purchasing power of particular currency.
Budget Balance as Percentage of GDP
Government Budget balance (GBB) is difference between income and expenses. The GBB (including grants) for a particular year is stated as gross domestic productions’ percentage.
Current Account as Percentage of GDP
Health of a company is calculated as Current account. If the exports are lower than imports of a particular country, then the country has positive current account and vice versa.
3.5.2 Financial risk rating
Financial Risk Rating provide mean of assessing the ability of a country to pay its way. A well-defined procedure is required to find out how a country finance its trade debt obligations. The risk rating points for financial risk and economic risk are same. Erb, et al. (1996), Hassan et al. (2003), and Suleman et al. (2017) used financial risk rating along with other components of country risk to find the relationship between country risk and stock return.
Foreign Debt Service
The foreign debt service is stated as percentage of total exports.
Current Account to Exports
Difference between the imports and exports and then divided by its exports.
Net International Liquidity
It incorporates the total reserves and it should be converted into US$ by using the avg. exchange rate of the given year.
Exchange Rate Stability
It explains the currency’s appreciation or depreciation considering US dollar as base. It is calculated as a change in percentage.
Current Account to Exports
Difference between the imports and exports and then divided by its exports.
3.5.3 Political risk rating
It helps in assessing the political steadiness and assigning risk points. The points are same for single component. In case of subcomponents, they are summed up for risk rating. Each sub-component shows four points (maximum score) equal to very low risk and zero points (minimum score) that equates to very high risk. Dimic et al. (2015) used political risk rating to examine the impact of political risk on stock returns.
Government Stability
Ability of a government to take away its publicized programs and its operational activities to perform task. 12 points are given to it. The sub-components consists of Legislative Strength, Government Unity, and popular support.
Socio-economic conditions
Socioeconomic pressures that limit government’ action or increasing the frustration. 12 points are assigned to it.
Investment Profile
Estimating the factors, those are affecting the specific investment. 12 points has been assigned to it. The subcomponents are Profits Repatriation, Contract Viability, and Delays in Payment.
Internal Conflict
Assessing the political violence and its effect on the governance of the country. Countries in which government is not indulged in direct or indirect violence against its citizen are assigned highest rating. 12 points are assigned to it. The subcomponents are comprised of Civil War, Terrorism.
External Conflict
Assessing the risk to government from the actions of other countries. 12 points has been given to it. The subcomponents are comprised of War, and Foreign Pressures.
Corruption
Extent to which corruption is dominant in political structure. Foreign investment may be affected by it as financial and economic environment is mis-represented. Corruption adversely effects the efficiency of business and government, and instability can be seen in the political system. This leads to withholding or withdrawal of investment. 6 points has been assigned to it.
Military in Politics
If military is involved at a minor level in politics leads to the attenuation of democratic accountability. 6 points are given to it. A military takeover shows a high risk as it indicate that the government operations are ineffective and the country’s environment is tense for foreign companies.
Religious Tensions
They arise from the control of particular religious group, who wishes to institute religious law by weakening civil-law. This group tends to eliminate other religions from the whole system. 6 points are assigned to it.
Law and Order
“Law and Order” are being measured individually but they form a single component. Each element (Law and Order) is scored from zero to 3 points. The overall impartiality and strength of the system is taken into consideration while assessing Law. The valuation of popular compliance of the law depicts Order. 6 points are assigned to it.
Ethnic Tensions
Assessin the degree of tension based on national, racial, custom, or language differences. 6 points are assigned to it. Higher ratings for countries depicting minimal tensions and low rating for countries depicting high national and racial tensions.
Democratic Accountability
Assessing the response of government towards its citizen. If government does not response actively then it will fall. In democratic system, removal of existing government wil take place in a peaceful way. Whereas, in non-democratic society, government will fall viciously. 6 points has been assigned to it.
Bureaucracy Quality
The quality and institutional strength of the bureaucratic system is another factor that inhibits policy revision when the governments change. Countries with strong bureaucratic system receives high points and countries lacking the strong bureaucratic system receives low points. 4 points are given to it.
3.5.4 Composite risk rating
The aggregated PR, FR, ER is calculated by using this formula:
CPFER = 0.5 *(PR + FR + ER)
Individual country risk is calculated using the following classification of Composite Risk.
3.6 Data collection
Secondary data is used for this study. Data of dependent variable is collected from web portal of PSX. The prices data was converted to returns for analysis purpose.
Data of independent variable is collected from official website of The Political Risk Service (PRS) group[8]. It is considered as the most reliable and trusted source for data.
3.7 Time horizon
The data collection time period is from 2010 to 2016. Yearly data has been collected for analysis purpose.
3.8 Data analysis
The empirical testing used in this study was divided into four parts. First, descriptive statistic has been used to find out mean, median, and kurtosis. Second, co-relation test has been conducted to check the relation of variables. Third, unit root tests of individual series has been undertaken to check the stationary. Finally, the fixed effect and random effect LS regression tests are used. To choose between these two, Hausman test is applied (Greene, 2008).
Descriptive statistics
Descriptive statistics explains the values of mean, median, kurtosis, standard deviation.
Correlation test
This test checks the collinearity of dependent and independent variables. If the multicollinearity exist among the variables, it would create the problems while calculating the model.
Unit root test
It is used to check stationary in the data. This test for every variable is conducted individually. (Levin, Lin and Chu, Im, Pesaran and Shin, ADF Fisher, PP fisher) tests are used. The decision has been taken on the basis of majority results. If data would be stationary at first difference, then co-integration test will be applied and for data to be stationary at level, regression test will be used. Stationary data is one whose statistical properties such as autocorrelation, variance, and mean all are constant over time.
Fixed effect and Random Effect regression model
The models of Panel data examine time effects, group effects, or both to deal with individual effect that may or may not be observed (Greene, 2007). These individual effects are either fixed effect or random effect. A fixed effect model is used to find either intercepts vary across time period or group (Greene, 2008). A random effect model explains differences in error variance terms across time period or individuals (Greene, 2008).
Fixed and random regression model are used to test the effect of country risk on stock market returns. After that, Hausman tests is conducted to choose between these two. In case of significant p value, fixed effect regression model is used and in case of insignificant value, random effect regression test is used.
Fixed effect regression Model
The key difference between fixed effect and random effects is whether the unobserved individual effect symbolises elements that are correlated with the regressors in the model, not whether these effects are stochastic or not (Greene, 2008). Two regression models are used.
Multiple Regression Model: three independent variables in Model 1 (Economic Risk, Financial Risk, Political Risk).
Model1: Yit = i+ 1ERit + 2FRit + 3PRit + it+ uit
Simple Regression Model: One independent variable in model 2 (Country risk). It as univariate regression as dependent variable is only one (Stock returns).
Model2: Yi = i + 1CPFERi + i + uit
Yit is the stock market return for ith term at time t. αi is hidden element that that is not observed and it fluctuates across units but it does not varies across time. β1, β2 and β3 are coefficients of explanatory variables. ERi is Economic Risk Premium rating of Pakistan is explanatory variable for the ith at time t, FRi is the Financial Risk Premium rating of Pakistan is explanatory variable for the ith at time t, PRi is the Political Risk Premium rating is explanatory variable for the ith at time t, and CPFER is the Composite risk premium rating comprised Economic risk premium, Financial risk premium, and political risk premium of Pakistan. i are the within-entity error terms and uit is between entity errors.
Chapter 4
Data Analysis and Results
This chapter comprise of results and analysis of data. It consists of composite risk rating table, descriptive stats and correlation tests and their detailed analysis. After that panel unit root test of variables is explained. Then fixed and random effect regression tests are conducted and finally pooled OLS test is explained.
4.1 Results of composite risk rating
Table 4.1 explains the composite country risk rating. The risk for every year and component is calculated separately. The values of economic risk, financial risk, and political risk are explained in table A, B, and C in appendix section.
Table 4.1
Composite risk rating from year 2010 to 2016
| Years | ER | FR | PR | CPFER | Risk band |
| 2010 | 30.5 | 38.5 | 53 | 61 | Moderate risk |
| 2011 | 30.0 | 38.5 | 55.5 | 62 | Moderate risk |
| 2012 | 31.0 | 35.5 | 49 | 57.75 | High risk |
| 2013 | 32.5 | 38.5 | 52 | 61.5 | Moderate risk |
| 2014 | 30.5 | 37.5 | 48.5 | 58.25 | High risk |
| 2015 | 30.5 | 37.5 | 51 | 59.3 | High risk |
| 2016 | 34.5 | 37.5 | 51 | 61.3 | Moderate risk |
The composite risk index shows a little variation over the period of 2010 to 2016.
Very High Risk: 00.0 points to 49.9 points
High Risk: 50.0 points to 59.9 points
Moderate Risk: 60.0 points to 69.9 points
Low Risk: 70.0 points to 79.9 points
Very Low Risk: 80.0 points to 100 points
In year 2010, the economic risk comprise of 30.5 points. The real GDP growth rate is 4.2 and inflation rate is 13.5. The current account as percentage of GDP is -2.8. The budget balance to GDP is -6.9. The GDP per head 957. The overall economic risk is moderate (table A). The financial risk comprise of 38.5 points. The current account percentage of exports is -11.5. The exchange rate stability is -1.8. The foreign debt as percentage of GDP is 35.6. The foreign debt services is 12.8. The net international liquidity is 3.5. The overall financial risk is low (table B). The political risk comprises of 53 points. The government stability has 6.5 points out of 12 that means it was moderate. The internal and external conflicts also show moderate values of 7 and 7.5 out of 12 points. The low value of military in politics 2.5 out of 6 indicates that military participation in government activities is higher. The overall political risk rating show high risk (table C). The composite risk therefore calculated as 0.5*(30.5+38.5+53) equals to 61 points that means the risk is moderate.
In year 2011, the economic risk comprise of 30 points. The real GDP growth rate is 2.5 and inflation rate is decreased by 2% compared to 2010. The current account as percentage of GDP is -2.3 that is slightly less than of 2010. The budget balance to GDP is -6.9. The GDP per head is 1126, higher than previous year. The overall economic risk rating show moderate risk (table A). The financial risk comprise of 38.5 points. The current account percentage of exports is -10.6, less than previous year. The exchange rate stability is -6.0, increased by 5 points than previous year. The foreign debt as percentage of GDP is 32.6. The foreign debt services is 13.9. The net international liquidity is 4.5, higher than previous year. The overall financial risk rating show low risk (table B). The political risk comprises of 55.5 points. The government stability has 6 points out of 12 that means it was moderate. Corruption is 3 out of 6 showing moderate results. The internal and external conflicts also show moderate values of 7 out of 12 points. Religious tensions show value of 2 out of 6 that means religious activities are at its peak. The low value of military in politics 2 out of 6 indicates that military input in government activities is higher. The overall political risk is high (table C). The composite risk therefore calculated as 0.5*(30+38.5+55.5) equals to 62 points that means the risk is moderate.
In year 2012, the economic risk comprise of 30.5 points. The real GDP growth rate is 3 and inflation rate is decreased by 2 points in current year compared to 2011. The current account as percentage of GDP is -3.1. The average of GDP per head is 6.83%, less than previous year. The overall economic risk rating show moderate risk (table A). The financial risk comprise of 38.5 points. The current account percentage of exports is -10.6, less than previous year. The exchange rate stability is -7.8. The foreign debt as percentage of GDP is 31.6. The foreign debt services increased to 20.5 from 13.9. The net international liquidity is decreased to 1.2 from 4.5. The overall financial risk is low (table B). The political risk comprises of 53 points. The socio economic conditions has 7 points out of 12 that means it was moderate. Corruption is 3.5 out of 6 showing moderate results. The internal and external conflicts also show moderate values of 6 and 6.5 out of 12 points, decreased by one point. Investment profile has 7.5 points. Religious tensions show value of 2 out of 6 that means religious tensions are very high. The low value of military in politics 1.5 out of 6 show that military is involved in politics. The overall political risk is high (table C). The composite risk therefore calculated as 0.5*(31+35.5+49) equals to 57.75 points that means the risk is high.
In year 2013, the economic risk comprise of 32.5 points. The inflation rate is 7 and the current account as percentage of GDP is -0.8. The average of GDP per head is 7.10%, higher than previous year. The overall economic risk rating show moderate risk (table A). The financial risk comprise of 38.5 points. The current account percentage of exports is dropped from -15.6 to -3.8. The exchange rate stability is -7.4. The foreign debt as percentage of GDP is 28.6. The foreign debt services decreased from 20.5 to 9.3 in this year. The net international liquidity is decreased to 0.8. The overall financial risk is low (table B). The political risk comprises of 52 points. The government stability and the socio economic conditions shows 6.5 points out of 12. Corruption is 2.5 out of 6 points showing that country is facing high level of corruption. The internal and external conflicts also show moderate values of 7 and 7.5 out of 12 points. Investment profile has same points as of previous year. Religious tensions show value of 1 out of 6 that means religious tensions are very high. The low value of military in politics 2.5 out of 6, slightly higher than previous year. The overall political risk is high (table C). The composite risk therefore calculated as 0.5*(32.5+38.5+52) equals to 61.5 points that means the risk is moderate.
In year 2014, the economic risk comprise of 30.5 points. The Real GDP growth rate is 3.5. The inflation rate is 8.1, higher than previous year and the budget balance to GDP is -6.8. The average of GDP per head is 7.10%. The overall economic risk rating show moderate risk (table A). The financial risk comprise of 37.5 points. The current account percentage of exports is increased from -3.8 to -11.9. The exchange rate stability is changed from -7.4 to 4.9. The foreign debt as percentage of GDP is 31.6. The foreign debt services is 8.7. The net international liquidity is decreased to 0.5. The overall financial risk is low (table B). The political risk comprises of 48.5 points. The government stability show value of 6 and the socio economic conditions shows 5 points out of 12. Corruption is 3 out of 6 points showing that country is facing moderate level of corruption. The internal and external conflicts also show values of 6.5 and 8 out of 12 points. Investment profile is 5 out of 12, showing that condition for investment are not suitable. Religious tensions show value of 1.5 out of 6. Law and order shows 3.5 out of 6 points. The low value of military in politics 2.5 out of 6. Bureaucracy quality is 1.5 out of 4 points. The overall political risk rating show very high risk (table C). The composite risk therefore calculated as 0.5*(30.5+37.5+48.5) equals to 58.25 points that means the risk is high.
In year 2015, the economic risk comprise of 30.5 points. All the points are same as of year 2014. The overall economic risk rating show moderate risk (table A). The financial risk comprise of 37.5 points. The exchange rate stability is changed from 4.9 to 5.1.The current account percentage of exports, the net international liquidity, and the foreign debt services is same as of previous year. The overall financial risk is low (table B). The political risk comprises of 51 points. The government stability and the socio economic conditions shows moderate values of 6.5 and 6.0 points out of 12. Corruption is 2 out of 6 points showing that country is facing high level of corruption. The internal and external conflicts also show values of 6.5 and 9 out of 12 points. Investment profile is 8. Religious tensions show value of 1 out of 6. Law and order shows 3 out of 6 points. The low value of military in politics 1.5 out of 6. Beau acratic quality is 2 out of 4 points that means it is moderate. The overall political risk is high (table C). The composite risk therefore calculated as 0.5*(30.5+37.5+51) equals to 59.3 points that means the risk is high.
In year 2016, the economic risk comprise of 34.5 points. The Real GDP growth rate is 5 and inflation rate is 7.5, lower than previous year. The budget balance to GDP is -5.9 lower than previous years. The average of GDP per head is 7.32%. The overall economic risk rating show moderate risk (table A). The financial risk comprise of 37.5 points. The current account percentage of exports is dropped from -11.9 to -3.8. The exchange rate stability is 5.8. The foreign debt as percentage of GDP is 29. The foreign debt services is 8.9. The net international liquidity is 1.1. The overall financial risk is low (table B). The political risk comprises of 51 points. The government stability and the socio economic conditions shows 6.5 points out of 12. Corruption is 2.5 out of 6 points showing that country is facing high level of corruption. The internal and external conflicts also show moderate values of 7 and 8.5 out of 12 points. Investment profile is 7.5. Religious tensions show value of 1 out of 6 that means religious tensions are very high. The low value of military in politics 1 out of 6, slightly lower than previous year. Beau acratic quality is 2 out of 4 points that means it is moderate. The overall political risk is high (table C). The composite risk therefore calculated as 0.5*(34.5+37.5+51) equals to 61 points that means the risk is moderate.
4.2 Descriptive statistics
The descriptive statistics describes mean, median, skewness, standard deviation, maximum, minimum, kurtosis, probability and the number of observations. Table 4.2 explains descriptive stats for independent variables and dependent variables.
Table 4.2
Descriptive Statistics for all variables
| SR | CR | FR | PR | ER | |
| Mean | 0.302810 | 60.14286 | 37.64286 | 51.42857 | 31.21429 |
| Median | 0.160848 | 61.00000 | 37.50000 | 51.00000 | 30.50000 |
| Maximum | 7.328745 | 62.00000 | 38.50000 | 55.50000 | 33.50000 |
| Minimum | -0.901808 | 57.75000 | 35.50000 | 48.50000 | 30.00000 |
| Std. Dev. | 0.672365 | 1.535565 | 0.990451 | 2.212408 | 1.191804 |
| Skewness | 2.968772 | -0.418491 | -1.172743 | 0.422507 | 0.944946 |
| Kurtosis | 22.37044 | 1.601696 | 3.080208 | 2.328492 | 2.342296 |
| Sum | 211.9670 | 42100.00 | 26350.00 | 36000.00 | 21850.00 |
| Sum Sq. Dev. | 316.0006 | 1648.214 | 685.7143 | 3421.429 | 992.8571 |
| Observations | 700 | 700 | 700 | 700 | 700 |
The mean and median measures the central tendency of the data (Lane, D. M., ch 3). The data is symmetrical as mean and median are similar in case of country risk and its components. In descriptive stats, maximum and minimum shows the max. And min. values in the sample. Standard deviation measures dispersion in the given data. (Lane, D. M., ch 3).
Skewness determines asymmetry of distribution of series around its mean. (eviews help, 10). The SR, ER, and PR show positive skewness, therefore the distribution is long right tail whereas CR and FR show negative values that means it is negatively skewed and the distribution has a long left tail.
Kurtosis tells about the peakness or flatness of the distributions (eviews help[9], 10). As the kurtosis value for Economic risk is 2.3. This value is less than 3 that means its graph is platykurtic. As the kurtosis value for financial risk is 3. This value is equal to 3 that means its graph is Mesokurti. The kurtosis value for Political risk is 2.32. This value is less than 3 that means its graph is platykurtic. The kurtosis value for Country risk is 1.60 and it is less than 3. Its graph is platykurtic. Graph 1 in appendix shows the distribution.
4.3 Correlation Test
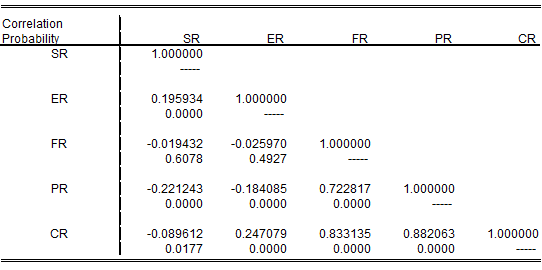
Correlation measures the association between two variables (Schober, Boer, & Schwarte, 2018). The correlated data is characterized as the variation in the magnitude of one variable is related with the variation in the magnitude of second variable. This change can be in same or in opposite direction (Schober et al., 2018). It ranges from –1 to +1. Positive one indicates strong correlation, negative one shows weak correlation, 0.5 indicates moderate relationship, and 0 indicates no correlation (Schober et al., 2018). This test is used to check the collinearity of variables.
Table 4.3
Correlation table
Correlation between stock return, Economic risk, Political risk, financial risk, and Composite risk
SR-ER: weak positive correlation
SR-FR: negligible negative correlation
SR-PR: weak negative correlation
SR-CR: negligible negative correlation
ER-FR: negligible negative correlation
ER-PR: weak negative correlation
ER-CR: weak positive correlation
FR_PR: strong positive correlation
FR-CR: strong positive correlation
PR-CR: strong positive correlation
This explanation is based on table D in appendix section.
4.4 Panel Unit Root Test
To check the stationary of data, this test will be used. Unit root for every variable is conducted individually. This study used the (LLC, IPS, ADF Fisher, PP fisher) panel unit root test. Stationary time series is one whose shape of distribution is not changed by the shift in time. It has constant mean and variance over time (Maddala & Lahiri, p. 266). A time series is considered as non- stationary if mean and variance depend on time. And non-stationary data tend to depart even further from any given value (Maddala & Lahiri, p. 266).
A non-stationary data can cause unusual and unexpected behaviours while calculating results. For instance t-ratios and t-distribution show different values and the variables those are not correlated and even show high R2 value (Maddala & Lahiri, p. 269). Distorted R2 value and no correlation between dependent and independent variable will lead to wrong regression results. If the time series has unit root that means series exhibit trend, so data is non-stationary. Therefore, it is de-trended to make data stationary and to get more reliable results. (Maddala & Lahiri, p. 266). There are two method for de-trending the data. One is successive differencing and the other is estimating regression on time (Maddala & Lahiri, p. 266).
Bilgili and Ozturk (2015) used the unit root test for panel data to check the stationary. The results showed that data was stationary at first difference not at level, therefore, they have applied panel co-integration test, as the basic assumption of panel co-integration test is that the variables should be integrated at same order not at level and then dynamic OLS regression tests. Steiger (2016) found influence of country risk premiums on stock market returns for developing and developed markets. This study applied the unit root test to check the stationary.
4.4.1 Unit root (Stock Returns)
Panel unit root test for stock return is performed. Table 4.4.1 depicts the results.
Table 4.4.1
Panel unit root test for stock market returns
| Cross- | ||||
| Method | Statistic | Prob.** | sections | Obs |
| Null: Unit root (assumes common unit root process) | ||||
| Levin, Lin & Chu t* | -19.8738 | 0.0000 | 100 | 500 |
| Null: Unit root (assumes individual unit root process) | ||||
| Im, Pesaran and Shin W-stat | -3.05626 | 0.0000 | 100 | 500 |
| ADF – Fisher Chi-square | 287.424 | 0.0000 | 100 | 500 |
| PP – Fisher Chi-square | 409.048 | 0.0000 | 100 | 600 |
|
Null hypothesis: stock return does have unit root Alternative hypothesis: stock return does not have unit root
|
||||
The results of this test shows that probability value is 0.000 for all tests and this value is less than 0.05. The null hypothesis will be rejected that means stock returns does not have unit root. Therefore, all the methods are telling that stock returns are stationary at level. A non-stationary data can cause unusual and unexpected behaviors. For instance t-ratios and t-distribution shows different values and the variables those are not correlated even show high R2 value. Systematic pattern is shown by the series that have unit root and this pattern is unpredictable. Inaccurate R2 value and no correlation between dependent and independent variable will lead to wrong regression results.
4.4.2 Unit root (Economic Risk)
Panel unit root test for economic risk is performed. Table 4.4.2 depicts the results of the test.
Table 4.4.2
Panel unit root test for Economic Risk
| Cross- | ||||
| Method | Statistic | Prob.** | sections | Obs |
| Null: Unit root (assumes common unit root process) | ||||
| Levin, Lin & Chu t* | -20.1682 | 0.0000 | 100 | 500 |
| Null: Unit root (assumes individual unit root process) | ||||
| Im, Pesaran and Shin W-stat | -4.06809 | 0.0000 | 100 | 500 |
| ADF – Fisher Chi-square | 303.412 | 0.0000 | 100 | 500 |
| PP – Fisher Chi-square | 62.1933 | 0.0000 | 100 | 600 |
Null hypothesis: Economic risk does have unit root
Alternative hypothesis: Economic risk does not have unit root
The results of this test shows that probability value is 0.000 for all tests and this value is less than 0.05. The null hypothesis will be rejected that means economic risk does not have unit root. Therefore, all the methods are telling that economic risk is stationary at level.
4.4.3 Unit root (Political Risk)
Panel unit root test for political is performed. Table 4.4.3 show the results.
Table 4.4.3
Panel unit root test for Political Risk
| Cross- | ||||
| Method | Statistic | Prob.** | sections | Obs |
| Null: Unit root (assumes common unit root process) | ||||
| Levin, Lin & Chu t* | -50.6751 | 0.0000 | 100 | 500 |
| Null: Unit root (assumes individual unit root process) | ||||
| Im, Pesaran and Shin W-stat | -14.4385 | 0.0000 | 100 | 500 |
| ADF – Fisher Chi-square | 637.911 | 0.0000 | 100 | 500 |
| PP – Fisher Chi-square | 360.239 | 0.0000 | 100 | 600 |
Null hypothesis: Political Risk does have unit root
Alternative hypothesis: Political risk does not have unit root
The results of this test shows that probability value is 0.000 for all tests and this value is less than 0.05. The null hypothesis will be rejected that means political risk does not have unit root. Therefore, all the methods are telling that political risk is stationary at level.
4.4.4 Unit root (Financial Risk)
Table 4.4.4 show the results of panel unit root test for financial risk.
Table 4.4.4
Panel unit root test for Financial Risk
| Cross- | ||||
| Method | Statistic | Prob.** | sections | Obs |
| Null: Unit root (assumes common unit root process) | ||||
| Levin, Lin & Chu t* | -81.2327 | 0.0000 | 100 | 500 |
| Null: Unit root (assumes individual unit root process) | ||||
| Im, Pesaran and Shin W-stat | -24.7935 | 0.0000 | 100 | 500 |
| ADF – Fisher Chi-square | 919.472 | 0.0000 | 100 | 500 |
| PP – Fisher Chi-square | 1208.01 | 0.0000 | 100 | 600 |
Null hypothesis: Financial risk does have unit root
Alternative hypothesis: Financial risk does not have unit root
The results of this test shows that probability value is 0.000 for all tests and this value is less than 0.05. The null hypothesis will be rejected that means financial risk does not have unit root. Therefore, all the methods are telling that financial risk is stationary at level.
4.4. 5 Unit root (Country Risk)
Table 4.4.5 show the results of panel unit root test for country risk.
Table 4.4.5
Panel unit root test for Country Risk
| Cross- | ||||
| Method | Statistic | Prob.** | sections | Obs |
| Null: Unit root (assumes common unit root process) | ||||
| Levin, Lin & Chu t* | -21.6166 | 0.0000 | 100 | 500 |
| Null: Unit root (assumes individual unit root process) | ||||
| Im, Pesaran and Shin W-stat | -13.9577 | 0.0000 | 100 | 500 |
| ADF – Fisher Chi-square | 624.038 | 0.0000 | 100 | 500 |
| PP – Fisher Chi-square | 675.826 | 0.0000 | 100 | 600 |
Null hypothesis: Country Risk does have unit root
Alternative hypothesis: Country risk does not have unit root
The results of this test shows that probability value is 0.000 for all tests and this value is less than 0.05. The null hypothesis will be rejected that means country risk does not have unit root. Therefore, all the methods are telling that country risk is stationary at level. A non-stationary data can cause unusual and unexpected behaviors. Systematic pattern is shown by the series that have unit root and this pattern is unpredictable. Inaccurate R2 value and no correlation between dependent and independent variable will lead to wrong regression results.
As the results for all variables show that data are stationary at level, that means no unit root exist and in this situation regression results are valid (Ouma & Muriu, 2014). For running the co-integration test, the basic assumption is that data should not be stationary at level rather it should be stationary at same order. As this assumption is not fulfilled therefore regression test is used.
4.5 Regression Analysis
The regression analysis is the final step. Hausman Test is applied. It helps to decide between a random effects regression and fixed effect regression model (Greene, 2008). Firstly fixed effect regression is calculated then random effect regression is estimated. The fixed effect regression tables are in appendix section (table E). Hausman test is applied on random effect regression results.
Stieger (2016) found influence of country risk premiums on stock market returns for developing and developed markets. The panel dataset was observed. This research has utilized Pooled OLS model, Random effect model and fixed effect model regression test.
Dimic et al. (2015) tried to explain how stock market returns of frontier, developed, and emerging markets are affected by political risk. The unbalanced panel dataset was examined. ICRG standard was used for political risk data collection. Fixed-effect panel regression model was estimated.
4.5.1. Regression Analysis, Predictors FR, ER & PR (Hausman Test)
This test is used as rule of thumb to choose between fixed effect regression and random effect regression (Greene, 2008). It basically tests whether the unique errors are correlated with the regressors. Table 4.5.1 depicts the value of Hausman test.
Table 4.5.1
Hausman Test
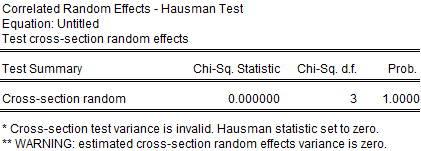
Two hypothesis are tested (Greene, 2008).
Null hypothesis: random effect test is preferred
Alternative hypothesis: Fixed effect test is preferred.
The results show that p value for Chi-sq. statistics for Composite risk index is 1.000 that is insignificant. This study will reject the alternative hypothesis and accept the null hypothesis. Therefore, random effect regression model is used.
4.5.2 Regression Analysis, Predictors FR, ER & PR (Random Effect)
The table 4.5.2 explains the random effect regression equation values of ER, FR, and PR.
Table 4.5.2
Random effect regression analysis
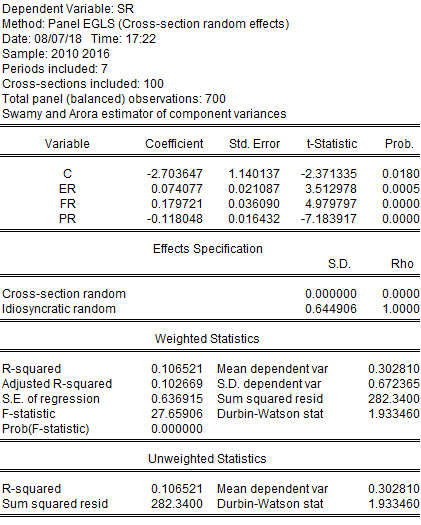
The fixed effect regression model shows the significant relationship between the ER, FR, PR and stock returns as p value in each case is less than 0.05. The coefficient value is positive in case of FR and ER, that means FR and ER positively affect the stock return. The coefficient value is only negative in case of PR, that means political risk negatively affect the stock return. The R squared value shows that independent variable brings 10.65% change in dependent variable (stock returns). F-statistics explains joint influence of independent variables on stock returns. As the p value of F-statistics is 0.000, showing that the results are accurate. Durbin-Watson stat value is 1.933 less than 2 that means positive autocorrelation.
Economic risk is significant at 1% level. Therefore, we will accept the H3 that economic risk does impact stock returns and reject the null hypothesis.
Stieger (2016) found influence of country risk premiums on stock market returns for developing and developed markets. Economic risk showed significant relation with stock market returns. Our analysis is also showing the same results.
Political risk is significant at 1% level. Therefore, we will accept the H4 and reject the null hypothesis.
Onder and Mugan (2006) conducted a research to find the impact of economic and political news on the emerging markets. They found that stock returns are effected by economic and political news.
Nazir et al. (2014) also conducted a research to investigate the relationship between political events and PSX. They concluded that political events has impact on PSX returns.
Ahmed (2017) conducted a research on effects of political regime in Egypt on stock market returns. The results suggested that political instability and uncertainty had a profound impact on the returns and volatilities of almost all sectors, with different intensity.
These results are consistent with our results so, we are accepting the alternative hypothesis.
Financial risk is significant at 1% level. Therefore, we will accept the H2 that financial Risk does impact stock returns thereby, rejecting the null hypothesis.
Bhati and Sultan in (2012), and Mehri in (2015) found that FR theoretically and empirically effect stock returns.
Mwaurah, Muturi, and Waititu (2017) investigated the effect of FR on stock market returns. They concluded that FR effects stock market returns.
These results are consistent with our results so, we are accepting the alternative hypothesis.
4.5.3 Regression Analysis, Predictor CR (Hausman Test)
This test is used to choose between fixed effect regression and random effect regression. Table 4.5.3 shows the value of Hausman test.
Table 4.5.3
Hausman Test

The given two hypothesis are tested (Greene, 2008).
Null hypothesis: random effect test is preferred
Alternative hypothesis: Fixed effect test is preferred.
The results show that p value for Chi-sq. statistics for Composite risk index is 1.000 that is insignificant. This study will reject the alternative hypothesis and accept the null hypothesis. Therefore, random effect regression model is used.
4.5.4 Regression Analysis, Predictor CR (Random Effect)
The table 4.5.4 explains the random effect regression equation values of country risk.
Table 4.5.4
Random effect regression analysis
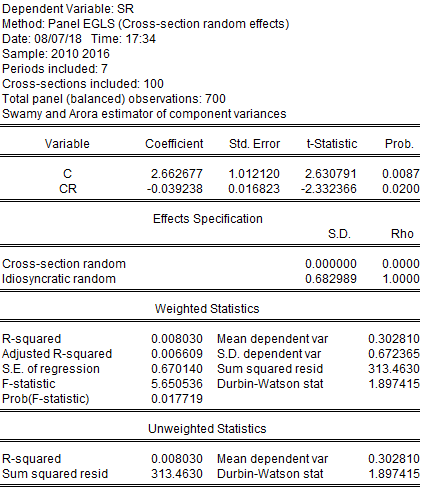
The random effect regression model shows the significant relationship between the country risk and stock returns as p value is 0.017. The R squared value shows that independent variable (country risk) brings 0.8% change in dependent variable (stock returns). The coefficient value of -0.0392 shows that the country risk negatively affect the stock return. The p value of F-statistics is 0.017 which is less than 0.05 so, the results are accurate. Durbin-Wats on stat value is 1.897 less which is than 2, showing positive autocorrelation.
Country risk is significant at 1% level. Therefore, we will accept the H1 that Country Risk does impact stock returns thereby, rejecting the null hypothesis.
Naumoski (2012) estimated the country risk premium in emerging markets and found that country risk and returns are strongly related.
Suleman et al. (2017) results indicated that stock market returns are effected by country risk and its components.
These findings show consistent results with our study, giving a reason to accept the results of this study.
Chapter 5
Conclusion and Recommendations
Country risk is generally risk associated to international businesses, explaining the cumulative situation and effects of risk (Mihaela & Alina, 2011). Due to globalization and crises experienced by the countries, stock returns volatility shows that higher level of risk experienced by the investors creates a sense of insecurity for the future investments. The study on the country risk is beneficial to determine the importance and attractiveness of economies and their competitiveness in market. The purpose of this study was to find the impact of country risk and its components on stock market returns of Pakistan. The dependent variable is stock market of Pakistan. The independent variable is CPFER and its three components FR, PR, and ER. Unit root and pooled OLS regression model are used to testify the relationship. The time period of this study is 7 years (2010 to 2017). The result of this study shows that country risk and its components has impact on stock market. These results are consistent with the previous studies as Naumoski (2012), Suleman et al. (2017), Stieger (2016), Hassan et.al (2003) results also show that stock market returns are affected by country risk. Therefore, while making an investment decision, Investors should consider the political uncertainties, financial developments, and economic changes taking place in Pakistan. They should consider the unexpected changes in political environment that could adversely affect their investment.
The findings of this paper will help Multinational companies, local and foreign investors, and practitioners. Investors will use these results will making the investment decisions. MNC’s will use these results as a screening device. It will help them to decide either their investments is safe or they should choose any other country possessing low country risk. Already working MNC’s in Pakistan can also use this data to analyse the current situation and make decision accordingly. If they feel that country risk is increasing over the period of time, then they may pull out their investment. Another reason for MNC’s to use this data to find out the particular form of risk like either it is economic risk that is effecting their investment decision or financial risk premium or Political risk that is relevant for the project, while considering Pakistan. While making an investment decision, Investors should consider the political uncertainties, financial developments, and economic changes of that country. They should consider the unexpected changes in political environment that could adversely affect their investment in such economies. The future research could be conducted using GMM model for panel data. As the sample size for this study is 100, more companies could be added to realize the impact. The results of this study can be used by investors, scholars, students, and policy-makers in future, to realize the degree of riskiness they will face while choosing Pakistan.
APPENDIX
These tables are extracted from the website of “The PRS group.”
| ECONOMIC RISK VARIABLES | |||||||||||||
| Real GDP growth rate | Weights | Inflation rate | Weights | Current account % GDP | Weights | Budget Balance to GDP | Weights | GDP per head | Average of GDP per head | Weights | TER | ||
| 2010 | 4.2 | 9.0 | 13.5 | 6.5 | -2.8 | 10.5 | -6.9 | 4.5 | 957 | 6.55% | 0.00 | 30.5 | |
| 2011 | 2.5 | 8.0 | 11.7 | 7.0 | -2.3 | 10.5 | -6.8 | 4.5 | 1126 | 7.32% | 0.00 | 30.0 | |
| 2012 | 3.0 | 8.5 | 9.8 | 7.5 | -3.1 | 10.5 | -6.5 | 4.5 | 1116 | 6.83% | 0.00 | 31.0 | |
| 2013 | 3.3 | 8.5 | 7.0 | 8.0 | -0.8 | 11.5 | -6.8 | 4.5 | 1206 | 7.10% | 0.00 | 32.5 | |
| 2014 | 3.5 | 8.5 | 8.1 | 7.5 | -2.5 | 10.5 | -7.2 | 4.0 | 1227 | 7.09% | 0.00 | 30.5 | |
| 2015 | 3.5 | 8.5 | 8.1 | 7.5 | -2.5 | 10.5 | -7.2 | 4 | 1270.227 | 7.19% | 0.00 | 30.5 | |
| 2016 | 5 | 9.5 | 7.5 | 8 | -0.7 | 11.5 | -5.9 | 5 | 1320.238 | 7.32% | 0 | 34.0 | |
Table#A ECONOMIC RISK VARIABLES
Table#B FINANCIAL RISK VARIABLES
| FINANCIAL RISK VARIABLES | ||||||||||||
| Current account % exports | Weights | Exchange rate stability | Weights | foreign debt % of GDP | Weights | Foreign Debt services | Weights | Net international liquidity | Weights | TFR | ||
| 2010 | -11.5 | 11.0 | -1.8 | 10.0 | 35.6 | 6.5 | 12.8 | 9.0 | 3.5 | 2 | 38.5 | |
| 2011 | -10.6 | 11.0 | -6.0 | 9.5 | 32.7 | 7.0 | 13.9 | 8.5 | 4.5 | 2.5 | 38.5 | |
| 2012 | -15.6 | 10.5 | -7.8 | 9.0 | 31.8 | 7.0 | 20.5 | 8.0 | 1.2 | 1 | 35.5 | |
| 2013 | -3.8 | 12.0 | -7.4 | 9.5 | 28.8 | 7.5 | 9.3 | 9.0 | 0.8 | 0.5 | 38.5 | |
| 2014 | -11.9 | 11.0 | 4.9 | 10.0 | 31.6 | 7.0 | 8.7 | 9.5 | 0.5 | 0 | 37.5 | |
| 2015 | -11.9 | 11 | 5.1 | 10 | 30.6 | 7 | 8.7 | 9.5 | 0.5 | 0 | 37.5 | |
| 2016 | -3.8 | 12.0 | 5.8 | 10.0 | 29.0 | 7.5 | 8.9 | 9.5 | 1.1 | 1 | 40.0 | |
Overall, an economic and financial risk rating of 0.0% to 24.5% indicates a Very High Risk; 25.0% to 29.9% High Risk; 30.0% to 34.9% Moderate Risk; 35.0% to 39.9% Low Risk; and 40.0% or more Very Low Risk.
| POLITICAL RISK VARIABLES | |||||||||||||
| A | Government Stability | 12 | G | Military in Politics | 6 | ||||||||
| B | Socioeconomic Conditions | 12 | H | Religious Tensions | 6 | ||||||||
| C | Investment Profile | 12 | I | Law and Order | 6 | ||||||||
| D | Internal Conflict | 12 | J | Ethnic Tensions | 6 | ||||||||
| E | External Conflict | 12 | K | Democratic Accountability | 6 | ||||||||
| F | Corruption | 6 | L | Bureaucracy Quality | 4 | ||||||||
| A | B | C | D | E | F | G | H | I | J | K | L | Risk point | |
| 2010 | 6.5 | 6.5 | 7.5 | 7 | 7.5 | 3 | 2.5 | 1 | 3 | 1.5 | 4.5 | 2.5 | 53 |
| 2011 | 6 | 7.5 | 9 | 7 | 7 | 3.5 | 2 | 2 | 5 | 1 | 3.5 | 2 | 55.5 |
| 2012 | 5.5 | 7 | 7.5 | 6 | 6.5 | 3.5 | 1.5 | 1.5 | 3 | 1.5 | 3 | 2.5 | 49 |
| 2013 | 6.5 | 6.5 | 7.5 | 7 | 7.5 | 2.5 | 2.5 | 1 | 3 | 1 | 4.5 | 2.5 | 52 |
| 2014 | 6 | 5 | 5 | 6.5 | 8.5 | 3 | 2.5 | 1.5 | 3.5 | 1.5 | 4 | 1.5 | 48.5 |
| 2015 | 6.5 | 6.0 | 8.0 | 6.5 | 9.0 | 2.0 | 1.5 | 1.0 | 3.0 | 1.0 | 4.5 | 2.0 | 51.0 |
| 2016 | 6.5 | 6.5 | 7.5 | 7 | 8.5 | 2.5 | 1 | 1 | 3 | 1.5 | 4 | 2 | 51.0 |
Table#C POLITICAL RISK VARIABLES
A political risk rating of 0.0% to 49.9% indicates a Very High Risk; 50.0% to 59.9% High Risk; 60.0% to 69.9% Moderate Risk; 70.0% to 79.9% Low Risk; and 80.0% or more Very Low Risk.
Graph#1 Kurtosis
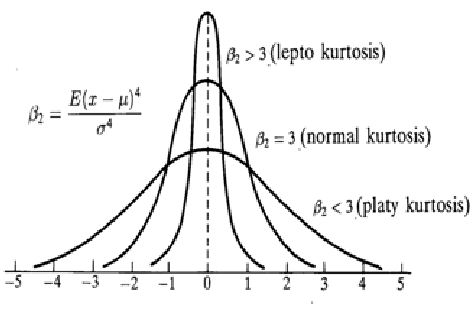
Table#D Correlation interpretation (Schober, Boer, & Lothar, 2018)
| Coefficient Interpretation |
| 0.00–0.10 Negligible correlation |
| 0.10–0.39 Weak correlation |
| 0.40–0.69 Moderate correlation |
| 0.70–0.89 Strong correlation |
| 0.90–1.00 Very strong correlation |
Table#E Fixed effect regression analysis test
E (1) Fixed effect test for RE, FR, PR
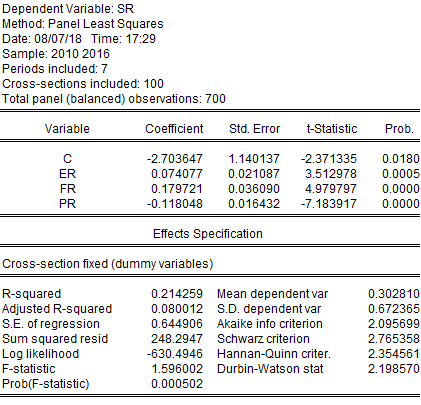
Students working on case studies or might need academic help, might find our custom Case Studies Writing Services helpful.
For more academic help please check a wide range of services our Economics Writing Help team offers:
– Economics Assignment Writing Services
– Economics Essay Writing Services
– Economics Dissertation Writing Services
– Buy An Economics Research Paper
Students working on case studies or might need academic help, might find our custom Case Studies Writing Services helpful.
Also look at some of our business services
– Business Essay Writing Service
– Business Dissertation Writing Services
– Business Report Writing
– Business Assignment Help
– Business Planning Writing Service
– Business Assignment Writing Service
In addition, for Accounting Writing Help please make sure check out services offered by our qualified accounting team:
– Accounting Coursework Help
– Accounting Dissertation Writing Services
– Accounting Essay Writing Services