


Part-A: Australia and China’s Business Cycle Stages
The diverse points in a business cycle are estimated using the proportional variation in real GDP of a nation. From 2018 to 2019, the Australian economy has been facing a contractionary phase in its business cycle. According to Tradingeconomics.com (2020), there is a plunge in real GDP from 2.65% to 1.73%, implying a weak production. Apart from investment spending, all the elements of aggregate demand rendered a positive impact on GDP. The expenditure incurred on investment dropped by 2.92% in 2019 (Australian Bureau of Statistics, 2019). Moreover, the rate of change in consumer spending is higher in 2018 compared to 2019, which is evident from a drop in consumer confidence in 2019. Similarly, China acknowledged a contraction in its business cycle due to a drop in real GDP from 6.6% to 6.24%. China experienced a growth in net exports, real consumption and investment. However, compared to 2018 there is a 0.4% less increase in consumer spending in 2019. Both the economies are witnessing a contraction because of gradual decline in GDP, which implies there is an absence of severe recessionary fall in real output.
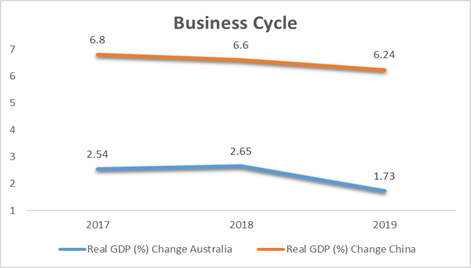
Figure 1: Different levels of business cycle amid China and Australia
Part-B: The Australian and Chinese Unemployment and its causes
The Australian economy, amid 2018 and 2019, witnessed a drop in the unemployment level from 5.3% to 5.2%. Conversely, the real rate of unemployment is +0.55% and +0.7% greater than the natural level of unemployment in both years respectively indicating a gap in real GDP. This can be related to the contractionary period obtained in 2018-2019 business cycle phase. Hence, a gap in domestic output along with contractionary stage in the business cycle indicates existence of cyclical unemployment in Australia, which occurred due to a decline in productivity of residential construction, retail business and public sector (Reserve Bank of Australia, 2020 pp. 32-33). However, the descent in the unemployment rate aroused due to job creation in the private sector.
Correspondingly, China perceived a drop in its unemployment level from 4.9% to 4.8% in the same span. Additionally, in 2018 and 2019, the unemployment gap in China is +0.1% and 0.2% respectively. The movement of the economy towards recession is relevant with the gap in GDP and joblessness. The fall in industrial productivity and trade in retail segment is an outcome of deterioration in export growth due to tariff war leading to rapid lay off of labour (Cheng 2019). However, the labour market report suggests a stabilising employment condition in the country due to rapid hiring in the finance segment, property market and insurance sector.
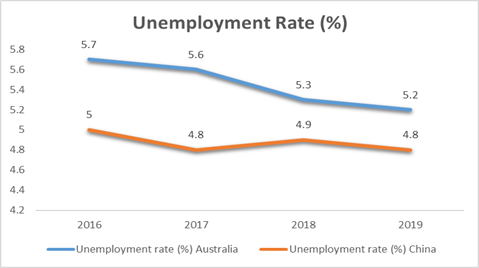
Figure 2: The different levels of unemployment
Part-C: Reason behind Inflation in China and Australia
The Australian economy experienced a 0.45% increase in GDP deflator in 2019. Thus, the category of inflation experienced by the Australian economy is cost-push. This is due to an upsurge in production costs, which is pushing aggregate supply to fall and increase the price level to raise the profitability margins of firms. This factor is evident from the index of production costs, which raised from 109.3 in 2018 to 111.4 in 2019 (Australian Bureau of Statistics, 2019). Moreover, there is no sign of the impact of aggregate demand and export-import index on inflation because of production side inflationary pressure on national demand.
In contrast to this, China is witnessing demand-pull inflation. The degree of inflation in China increased from 1.42% to 3.28% amid 2018 and 2019, which resulted from an increase in consumer confidence (Tradingeconomics.com, 2020). Moreover, both investment and export recorded positive and steady growth in 2019 leading to a positive movement of aggregate demand. However, a rise in import cost due to tariff affected businesses and consumers, which is relevant from the index of export-import. This outward movement amplified the volume of output and price level in China leading to demand-pull inflation.
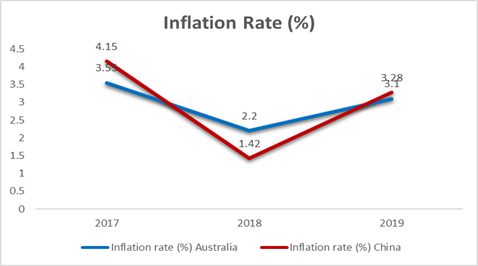
Figure 3: Inflation rate of Australia and China
Part-D: Concluding remarks and Analysis
The firm should develop its occupational activities in China because of its higher consumer confidence, lower production costs and a small gap in GDP. Higher GDP growth and a lower cost of salaries, raw materials and capital are beneficial for international business firms that are aiming at establishing in China. Moreover, a depreciated exchange rate helps in raising exports and GDP of the country, which is beneficial for international business. Additionally, the cost of business establishment in China is less in terms of the US dollar compared to Australia. To be specific, the cost of a similar product in both countries requires a less US dollar investment in China because of its lower currency value against the US dollar. However, in comparison to China, Australia has a higher production cost, weak productivity and appreciated currency value, which can affect the business growth and allocating expenditure negatively. Therefore, it is profitable for a small and medium-sized international firm to settle its business operation in China.