Institutional asset and liability management
Secretary of the Credit Risk Committee Memo
MEMORANDUM
To: NAB Credit Risk Committee
From: NAB Credit Risk Division
Date: October 29, 2020
Subject: NAB Credit Risk Analysis Report Review
This is to request for a meeting schedule to review the Credit Risk Analysis Report done by Credit Risk Division at National Australia Bank denoted (NAB).
The NAB Credit Risk Division main task is to assess and evaluate credit worthiness of clients of all social status form big corporations, financial institutions, manufacturing and ICT both within and outside Australia.
The Report presents risk exposure findings, and recommendation. Please be sure to attend.
Best regards;
Credit Risk Division
Executive Summary
This paper presents analytical report done by Credit Risk Division at National Australia Bank denoted as NAB. The bank is charged with the mandate to protect clients with assets listings in both domestic and international stock exchanges and whose loan amount exceeds $500 million. The NAB Credit Risk Division main task is to assess and evaluate credit worthiness of clients of all social status form big corporations, financial institutions, manufacturing and ICT both within and outside Australia. However, the report on this paper focused solely on Australia Big Four Financial Institutions.
The strategy focus for the banks has been to make business operations as efficient and reliable as possible. The Australian big four banks have undertaken tremendous amount of change in customer service, adoption of technology, risk taking and products innovativeness. This was caused by the pressure to remain at the top and also try and survive the effects of COVID-19 pandemic. The cost associated with this impairment to loans as a result increased significantly by over 226% ($5.7 Billion). Impairments of loans interest rates have far reaching effects to both financial and other economic sectors. Some of the effects are; rise in unemployment rates, slow in GDP growth and deterioration of property value and prices within a short period of time (Pham and Daly, 2020). Although CBA bank has not yet disclosed the impact of COVID-19 on its operations, other banks have clearly shown the far-reaching effects of the pandemic for the year 2020 – 2021. Some of innovations achieved by the four banks is diversification to more risk but rewarding complex wealth management and insurance products.
In conclusion, all the four banks used the methodology of VaR to measure risk exposure for the market. What makes VaR modelling the best market risk measure is its ability to quantify and estimate losses and likelihood of those losses occurring.
Introduction
This paper presents analytical report done by Credit Risk Division at National Australia Bank denoted as NAB. The bank is charged with the mandate to protect clients with assets listings in both domestic and international stock exchanges and whose loan amount exceeds $500 million. The NAB Credit Risk Division main task is to assess and evaluate credit worthiness of clients of all social status form big corporations, financial institutions, manufacturing and ICT both within and outside Australia. However, the report on this paper focused solely on Australia Big Four Financial Institutions.
The reason for more focus and emphasis to the three banks is the amount of risk exposure that is associated with the banks. The most critical tool in the analysis would be the annual report for the three banks that would be released and reviewed by Mid November of 2020. The results and findings from the analytical risk analysis for all the banks is to be presented to a Credit Risk Analysis Committee for decision making and planning (Hallunovi and Berdo, 2018). The committee is to be made up of but not limited to NAB bank CRO, CFO and CEO.
In order to assess the risk, the study computed financial ratios for all the four banks and compared the outcome with publicly available information and data. The critical statistic i=on which a decision was based is the upper or lower limits for each bank’s ratio control. The limits were used to raise credit risk exposure red flags that would require keen attention form the Banks management.
The major limitation that would be encountered in this research is limited, missing or incomplete financial data for the bank. However, despite the drawbacks, the report presented an informative trend analysis for each banks risk exposure and performance. The findings of the analysis conclude that NAB should consider renewing the contracts for ANZ, WBC and CBA banks as they represent a reasonable risk exposure for the bank (Hamza, 2017).
Part 1: Banks Comparative Ratio Analysis
This section presents a comparative financial ratio analysis for CBA, NAB, WBC and ANZ banks risk exposure. The main risk analyzed under this section are Strategic risks, Market Risks, Liquidity Risks, Interest Rate Risk and Credit Risk for financial institutions.
Strategic Risk Analysis
Considering the share process movement for the bank over a period of past three months, we see CBA stock price rose by up to 19.43%. On the other hand, NAB and WBC share prices rose by 16% only on average. CBA fulfilled its dividend payment schedule on September 30, 2020 thanks to its competitive product while WBC was forced to differ the payments due to harsh economic times (Salim et al., 2017).
The strategy focus for the banks has been to make business operations as efficient and reliable as possible. The Australian big four banks have undertaken tremendous amount of change in customer service, adoption of technology, risk taking and products innovativeness. Some of innovations achieved by the four banks is diversification to more risk but rewarding complex wealth management and insurance products.
The strategic move aims at reducing risk, cost and complexity of banks business while achieving maximum profitability and efficiency. The leading retails bank of the three Australian giants is CBA which has intensions of diversifying to grow its potential. These banks compete at disruption and being the best in product innovation, customer service, automated operational systems and technology. The companies have made huge investment in Artificial intelligence, block chain and big data as their strategic move in the banking segment (Afolabi et al., 2020)
The Big Four have diversified form small business services, retail banking, institutional to corporate banking. They cover almost every aspect of financial market needs. As a result, the banks have been growing at a fast rate and NAB has reached 1,590 branches across Australia, Asia and New Zealand serving at least 12 million customers per annum. On the Other hand, CBA has 1,680 branches with over 60 thousand employees all over the world. And with 1,200 branches and 20,000 employees is the AZN bank.
The main threat that these banks face is not from Australian competitors such as Neobanks or Fintech companies but rather US and China Tech Giants threats. The US and China threaten Australian banks due to availability of cheap labor, government incentive, reduced regulations and restrictions and availability of resources in these countries. The main advantage the Big Four have is the amount of cash reserves and capital they hold. The accumulated capital by these banks shield them against economic crisis.
Interest Rate Risk Analysis
The main sources of income for the banks is derived from interests received from loans issued by banks to individual people, institutions, companies, or corporations. But in order to attain an equilibrium, banks need to balance between loans risk and margins from loan interest rates (Isanzu, 2017).
However, maintain a balance of Net Interest rate Margin is the main challenge to majority banks. For example, NAB cash basis reduced three pints compared to CBA. The decline can be attributed to the switch that saw the banks mover from higher to low and competitive Net Interest Margins. This was caused by the pressure to remain at the top and also try and survive the effects of COVID-19 pandemic. The cost associated with this impairment to loans as a result increased significantly by over 226% ($5.7 Billion). Impairments of loans interest rates have far reaching effects to both financial and other economic sectors. Some of the effects are; rise in unemployment rates, slow in GDP growth and deterioration of property value and prices within a short period of time (Pham and Daly, 2020). Although CBA bank has not yet disclosed the impact of COVID-19 on its operations, other banks have clearly shown the far-reaching effects of the pandemic for the year 2020 – 2021.
The sources for the data used in the modeling of association between risk and revenue for Australian banks was obtained from Australian Bankers Association database. It’s evident that risk exposure for banks increase with reduction in revenue accumulation by the said banks. In other words, if the banks have very low concentration of revenue and ono-interest income, the risk level are way far low. The changes in causal relationship between revenue accumulation and risk exposure was accelerated by the 2008 global financial crisis which left several banks bankrupt. Therefore, diversification of revenue and non-interest income, on general has no impact of risk of defaulting on banks but it reduced profitability of the banks significantly (Ali and Dhiman, 2019).
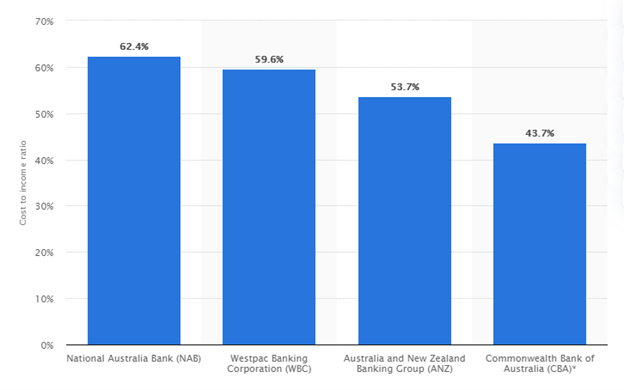
Next, comparing the four banks cost to income ratio, we find CBA bank had the least ration of about 43%, then followed by ANZ, WBC and NAB at 53%, 59% and 62% respectively as shown in Figure 1 below.
Market Risk Analysis
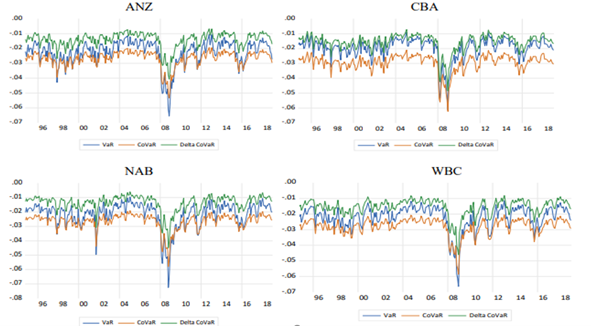
Figure 2 below presents a comparative analysis of time varying market risk for the banks modelled using VaR, ΔCoVaR, and CoVaR methodology. The red, green and blue trends display market risk measured using CoVaR, ΔCoVaR and VaR respectively. The spikes for all the market risk measures are sharp and high during financial crisis periods and less during pre-crisis time of the market (Zakaria, 2017).
The market products across the four banks that carried the greatest risk according to the VaR markets are instruments which were not backed by any kind of physical assets or securities. These instruments are innovative products by banks and corporate organization which are complex, has high risk exposure but also high rate of returns, Mos of the banks involved in these risky products as competition increased, greed and pressure to remain in business (Atkin and Cheung, 2017).
In the Trading book for banks, diversification plays a vital role in minimizing banks exposure to systemic risk. As a result, banks are able to absorb liquidity and other financial shocks quickly and remain profitable. Thus, for the Australian Big Four banks, lower VaR values could be as a result of banks products diversification.
Credit Risk and Credit Portfolio risk
As of October 2020, the Big Four Australian banks Non-performing Loans (NPL) Ratio was at 1.2% in comparison to 1.1% in the past few previous quarters. The NPL are loans on assets that are impaired and overdue for a period of more than 90 days (Le et al., 2020).
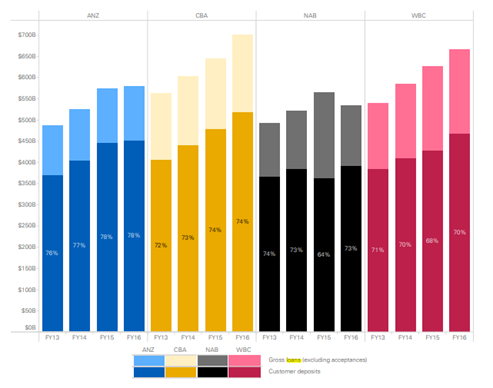
In order to cover, non-performing loans, banks need reserves in capital or cash. According to the financial report released by the banks, money supply had increased by 12% on average with a Reserve of $33.4 Billion by October 2020 in foreign exchanges as shown in Figure 3 below.
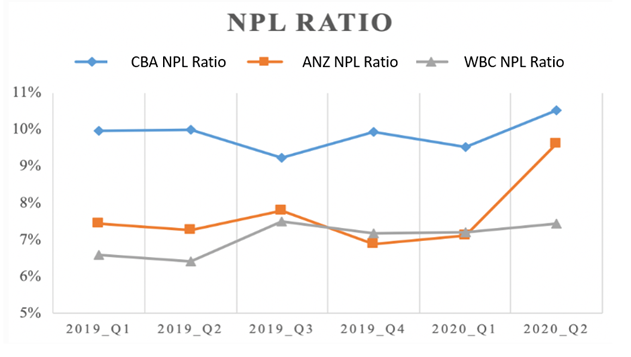
The ratio represents the rate of default by loan borrows over a period of time. Both CBA and ANZ had a rise in NPL ratio for the first two quarters of 2020 as shown in Figure 4 below. This represents poor quality of loans issued at this period. Possible reason was due to the slowdown in the economic activities due to governmental measures in fight against COVID-19 pandemic and lockdown. CBA NPL increased to 10% from 7% during this period which imply a loss of $3 for every $100 worth of loans issued to the borrowers who then defaulted (Naili and Lahrichi, 2020).
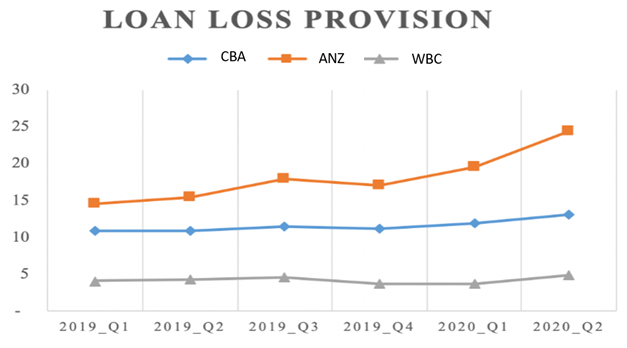
To try and cover Non-performing loans, banks set aside some kind of reserves of loans which have not been collected from borrowers to try and minimize the impact of emerging non-performing loans. During the time when the pandemic hit hard and lockdowns were enforced all over the country, banks increased loan loss provisions to try and control the situation and minimize their risk exposure as shown in Figure 5 below.
The increase in the amount set aside as loan loss provision would be charged on banks operational incomes which in terms affects the net income distributed to shareholders. Since no one know for sure how long it will take for the economy to recover, banks have no option other than to prepare for the worst as they hope for the best.
Liquidity Risk Analysis
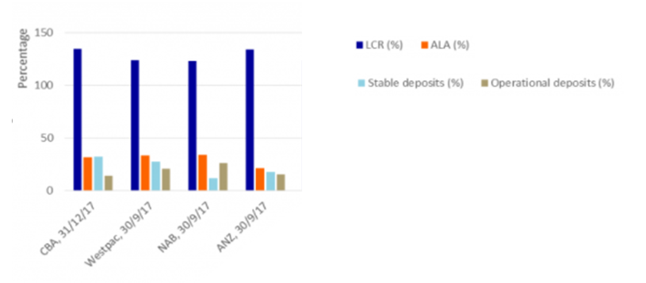
Australian Big Four banks published their Liquidity Coverage Ratio (LCR) according to Basel III guideline which require financial institutions to publicly disclose their semi and annual Pillar III reports (Torvekar and Game, 2019). The Australian banks performed as shown in the statistical LCR Figure 6 below.
Part 2: Banks Risk Evaluation
The banks to be analyzed and their risk profile compared are; Commonwealth Bank of Australia (CBA), Westpac Banking Corporation (WBC), and Australia & New Zealand (ANZ) Banks. In addition, NAB would be included in all the comparative analysis to act as a comparison benchmark. The analysis would be based on a financial datafile downloaded from NAB database and news feeds from financial journals and newspapers.
All the four banks used the methodology of VaR to measure risk exposure for the market. What makes VaR modelling the best market risk measure is its ability to quantify and estimate losses and likelihood of those losses occurring. To achieve this, we first analyses the dependency of individual banks products structures, and then evaluate performance to an index over a specified period of time. Inorder to estimate and long, short- and medium-term model spillover effects of the banks, ΔCoVaR and CoVaR models are fitted as in Table 1 below.
Part 3: Conclusion and Recommendations
Although financial institutions had tough times in the recent past, the main cause of distress in the banking sector is due to increased loan default rate. This is attributed to lack of proper stands and qualification of customers before issue loans. Other factors that may result to increase to Non-performance loans ration is poor credit risk management and lack of awareness of the current economic trends in the financial market.
Credit risk occur as a result of a likelihood of a borrow to fail to repay their loans as stated in the agreement. The objective of credit risk analysis is to minimize Non-performing loans and exposure to the bank while increased profitability a minimized cost. For Credit management system to be effective, it needs to address credit risk for the portfolio as a whole as well as risk associated with individual banks transactions. In conclusion, since all the three banks had a strong strategic risk management system, NAB should consider renewing the contracts for ANZ, WBC and CBA banks as they represent a reasonable risk exposure for the bank.
Appendices
Table 1. Market Risk Measure using VaR
Figure 1. Banks Cost vs Income Management
Figure 2. Time-varying VaR Trend Analysis
Figure 3. Australia Big Four Banks Non-Performing Loans Distribution
Figure 4. NPL Ratios
Figure 5. Loan Loss Provision
Figure 6. Liquidity Ratio Statistics


