


Petronas Gas BHD Financial Analysis Management
Financial Management Assignment
Question.1
Introduction
Petronas Gas Bhd
PETRONAS, or Petroliam Nasional Berhad, is a Malaysian petroleum and gas company established in 1974. The Malaysian government owns the company entirely. The business oversees developing and improving these capabilities, as well as the entire Malaysian oil and gas assets market. Petronas is one of the Fortune Global 500’s biggest corporations in the country. Petronas is ranked as the world’s twelfth most prosperous and productive company in Asia by Fortune. Petronas is involved in almost every field of the oil and gas business, from upstream discovery and mining to downstream refining and chemical sales, by subsidiaries and joint ventures. At the end of March 2005, the Petronas Group included 103 directly operated affiliate businesses, 19 partly owned outfit firms, and 57 associated agencies. These businesses are part of the Petronas Group, which is involved in a variety of oil and gas operations. The Group is involved in a broad variety of petroleum activities, including upstream pipeline production and oil and gas processing for downstream petroleum extraction, selling and sale of petroleum goods, pipeline operations, the petrochemical sector, transportation, automobile engineering, and marketing. Petroleum-based materials PETRONAS follows the main integration, value-adding, and globalization strategies. They also conduct activities ranging from upstream petroleum and gas exploration to output and downstream petroleum refining, petroleum oil marketing and selling, gas processing and liquefaction, gas transport pipeline operations, liquefied natural gas marketing, as well as the production and sale of petrochemical goods, transportation, and land use acquisition (SitesGoogle, 2020).
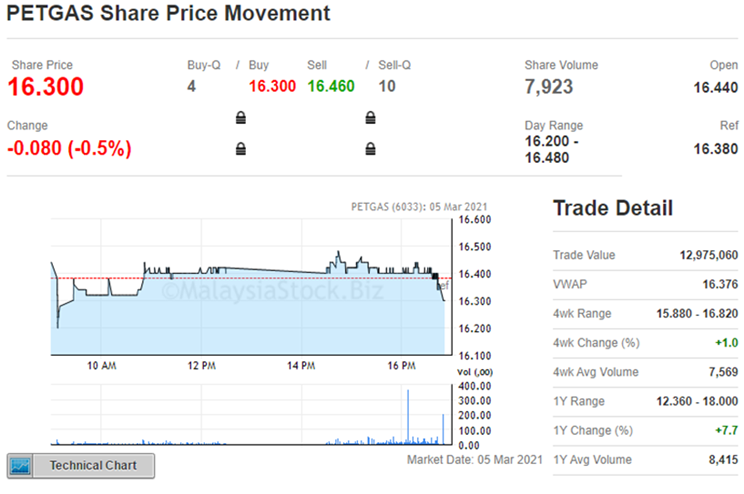
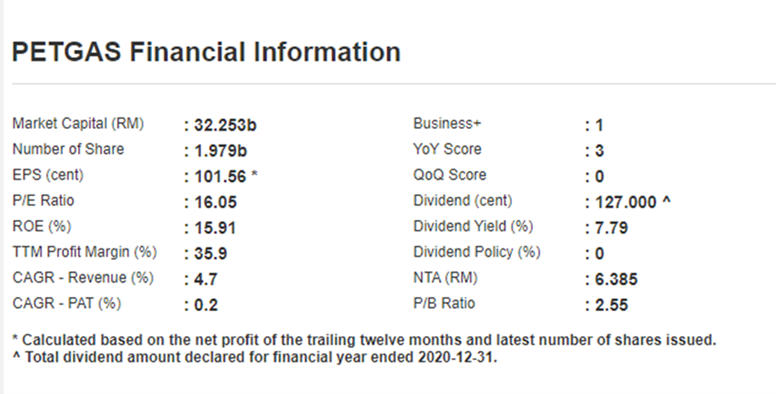
The final share price of PETRONAS is 16,300. The company’s profits per share is 101,56*, and the payout (cent) is 127.000. PETRONAS’ net income in 2019 and 2020 is described in terms of RM485273000 and RM503352000, respectively. PETRONAS has a market capitalization of RM32,253 billion (AnnualReport, 2020).
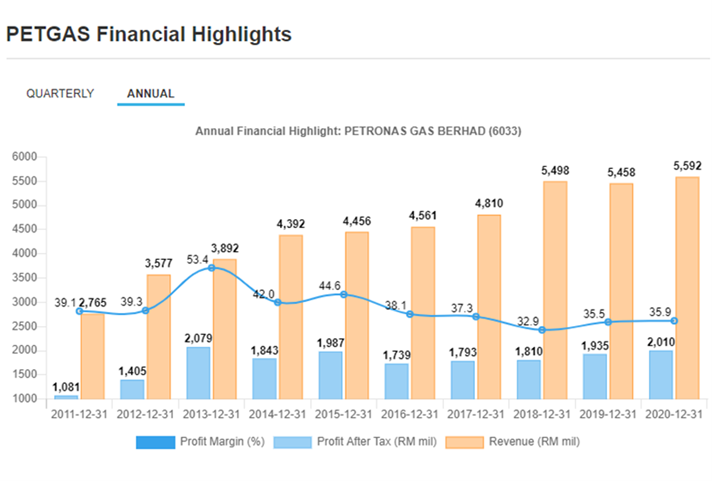
Also, net revenue increased by 3.84 percent year on year (2019), rising from 1,94 billion to 2,01 billion rm1372,379,000 to Rm1,388,740,000 rm1. The decrease in the cost of products sold was a percentage of the rise in net profits, which ranged between 56.27 and 52.50 percent (AnnualReport, 2020).
Petronas is one of the world’s leading oil and gas companies, as well as Malaysia’s largest pipeline and store.
Nestle Malaysia.
Nestlé (Malaysia) Berhad is an investment holding company. The company is divided into two segments: nutrition and Nestle Professional, food and beverages, and others. Nestlé products are classified as follows: coffee and drink, foodstuffs, milks, liquid food, junior snacks, breakfast cereals, chilled milk, ice cream, chocolate and sweets, lifestyle for health, vitamin performances, and professional Nestle. Nestle produces a variety of products, including Milo, Nescafe, Maggi, Nespray, and Kit Kat. The business manufactures cereal in the area. Nestle was listed on the Main Market of the Bursa Malaysia in 1989 (Emis, 2021).
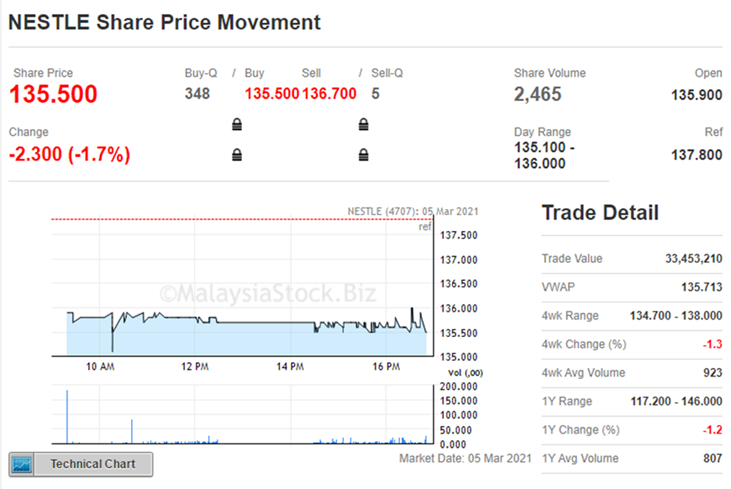
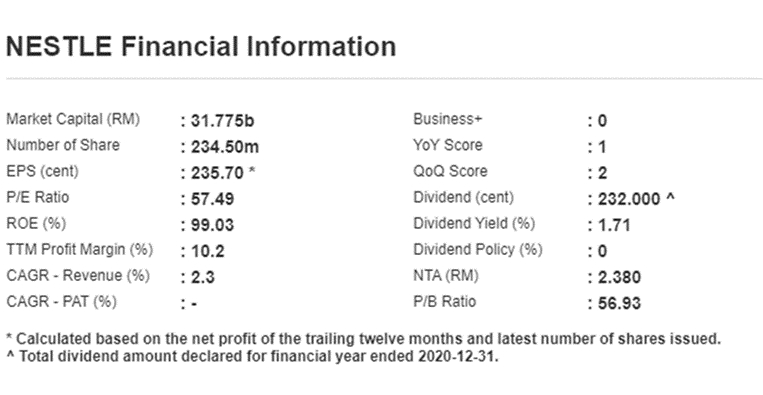
In 1989, the business was valued at RM 5,2 on the Malaysian Stock Exchange. Nestle Bhd offered significant windfall returns to shareholders today. RM135,500 per action equals a total of RM235,70 in 2020. The company’s dividend (cent) is RM232.000. Nestle Bhd’s net income is expected to be RM131,819,000 in 2019 and RM132,486,000 in 2020. Nestle Bhd’s market capitalization is RM31.577 billion (malaysiastock, 2021).Nestl Bhd saw a 1% net churn from RM1,38,892,000 to RM1,372,379,000 year on year (2020)
It is the country’s largest halal manufacturer. Malaysian Nestle. About 20% of the overall volume is exported to more than 50 nations (NESTLEGROUP, 2021).
Question.2
Main Sources of Financing Petronas
In the case of corporate finance, companies may choose from two types of financing (Rossi, 2016). The first step should be to raise equity capital from domestic sources, primarily by the selling of company securities to new or existing shareholders, eventually leading to the expansion of the corporate structure. Second, overseas debt financing, which entails selling bonds, notes, or periods to creditors from outside the market environment of other firms (usually takes the form of a corporate loan) (Marco, 2016).
Almost all companies utilize two distinct funding channels: external – debt finance and internal – equity financing. This funds mostly assist businesses by providing funds that essentially fulfil their needs and desires to finance a specific project. In a world like Malaysia, where technology is exploding every year, it is critical to invest in further ventures that will ultimately contribute to economic growth and prosperity for IT businesses, and they are heading towards IR 4.0. As a result, these companies are working hard to manage their organizational operations efficiently and effectively. Such active business activities generate a substantial amount of finance, requiring only external (debt) or internal (equity) sources of funding (Marco, 2016). Long-term obligations of companies: the primary instruments of entry into their company are bonds or binding commitments. It addresses the long-term financial requirements of prospective businesses. As a result, Petronas Gas Berhad capital’s base, whether international or domestic, is maintained through these sources of financing. They track their capital status so that businesses can retain an optimal capital position, better execute on aggressive projects, and maximize shareholder benefit (AnnualReport, 2020).
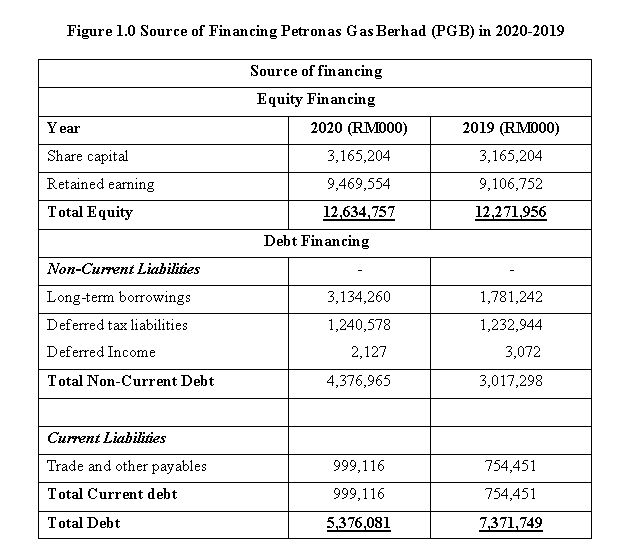
As can be seen from the Petronas Gas Berhad (PGB’s financial position), by 2020, more money was provided by internal sources, some RM121,800 million, while the external capital structure grew dramatically from its predecessor.
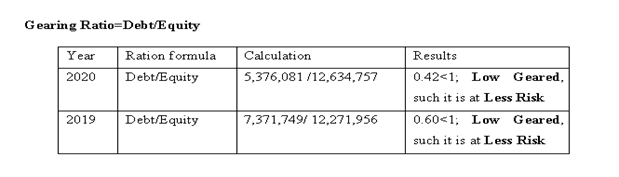
Gearing Ratio Interpretation
The Petronas Gas Berhad (PGB) financial status in 2020 revealed numbers of 0.42 or 42 per cent gear ratio. In 2019 the rate of gear ratio grew to 60%. Horrigan (1965) notes that firms with a figure below the 1.0-point mark are deemed less risky carriers. Petronas Gas Berhad (PGB) thus has less strategic leverage, rendering it less prone to financial turmoil or corporate reversal.
Q3. Main Sources of Finance Nestle Malaysia
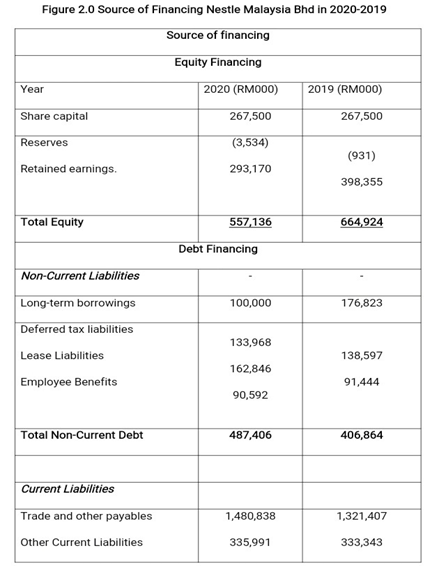
Source: Annual Report 2020
According to Nestle Malaysia Bhd’s financial statements, the company raised more money from internal sources (about RM 12 million) in 2020, although the structure of international capital rose significantly compared to the previous year.
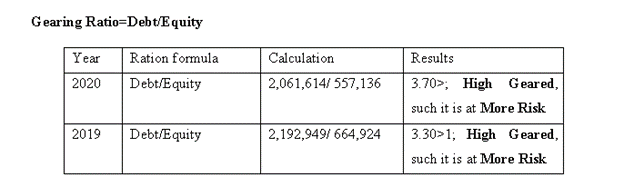
Interpretation of the Gearing Ratio
Nestle Malaysia Bhd financial conditions in 2020 showed a gearing ratio of 3.70 percent. In 2019, this gear ratio figure increased to 330 percent. According to Horrigan (1965), companies with an average of 1.0 point are classified as higher risk carriers. As a result, Nestle Malaysia Bhd has more strategic resources, making it more vulnerable to financial pressure or market downturns.
Analysis of capital structure
Any volume of debt/equity used by a corporation to support its activities and investments is known to be a capital structure. The composition of the capital is determined by the capital addition and the long-term debt (TUOVILA, 2021).
Capitalization of an entity transmits the permanent/long-term financial configuration of an enterprise consisting of a mixture of debt and equity. A robust share of capital is a symbol of financial maturity compared to debt resources in a business capital structure (Myers, 2001).
Capital Structure of Petronas
In general, analysts use three separate ratios to determine the financial fitness of a capital structure in an institution, including debt and equity. However, the “capitalization cost” provides important information about the business’s capital roles (Richard loth, Jan 2017).
The PETRONAS Financial Structure Analysis, focusing on the 2020 and 2019 balance sheets, is seen below.
Leverage Ratio = long-term debt / equity
Petronas ratio: 2020 = (3,134,260/12, 634,757) = 0.24
2019 = (1781,242/271,956) = 0.15
According to the latter, after calculating the leverage ratio and the Petronas equity liability ratio, the debt-equity ratio for 2020 is 0.24 and for 2019 is 0.15; since the debt-equity ratio is less than one, it indicates that most of the company funds its investments with equity rather than debt.
In most large industries, the debt-to-equity ratio ranges from 1.0 to 1.5. It also demonstrates that, from a financial standpoint, PETRONAS has not been proactive in financing its debt growth; therefore, the probability of financial difficulties could be lower on the road (FERNANDO, 2021).
Nestle Malaysia Bhd Capital Structure
The capital structure study for Nestle Malaysia Bhd in 2018 and 2019 can be found below, according to the year’s balances.
Lift Ratio = long-term debt / equity
Nestle Malaysia Bhd leverage ratio; 2020 = 100,000/557,136 = 0.17
2019 = 176,824/664,924= 0.27
Based on the information given above, we can conclude that the debt ratio of Nestle Malaysia Bhd for both 2020 is 0.17 and 2019 is 0.27, since the percentages are less than one, indicating that the bulk of the organization’s assets are funded by equities rather than debts.
In most large industries, the debt-to-equity ratio ranges from 1.0 to 1.5. This also implies that Nestle Malaysia Bhd has been unable to fund its growth by debt; hence, the possibility of financial difficulties along the way could be lower (FERNANDO, 2021).
Question.4: Evaluation and Analysis
We will revisit the five main sources of financial funding for each entity based on their balance sheets to determine the sources of financial services for both companies in this report, as well as an examination of their capital structures.
| Sources of Finance | Patronas 2020 – 2019 | Nestle 2020 – 2019 |
| Retained earnings | 9,469,554– 12,271,956 | 293,170- 398,355 |
| Deferred Taxes – cred | 1,240,578– 1,232,944 | 133,968– 138,597 |
| Long Term Debt | 3,134,260- 1,781,242 | 3,134,260- 176,823 |
| Shareholder’s Equity | 12,634,757 – 12,271,956 | 557,136- 664,924 |
As we examined the primary sources of financing in 2020 and 2019, we will determine the sources of funding for both companies and then review them based on their respective balance sheets the following year.
- Long-term debt: As seen above, Petronas had 3134260 million debt records for 2020 and 2019, and Nestle Malaysia Bhd had 3134260 million debt and 176,823 million debt, respectively. 1. Since Petronas’ leverage ratio is much higher, Petronas is significantly more reliant on long-term debt than Nestle.
- Equity: In the 2020 and 2019 shareholder equity scenarios, Petronas was slightly higher than Nestle Malaysia Bhd. As a result, Petronas depended on its equity far more than Nestle Malaysia Bhd.
- The deferred Petronas tax between 2020-2019, as reflected in both companies’ balance sheets, was comparatively higher than Nestle Malaysia Bhd. This suggests that Petronas depended on late taxes for future funds slightly more than Nestle Malaysia Bhd.
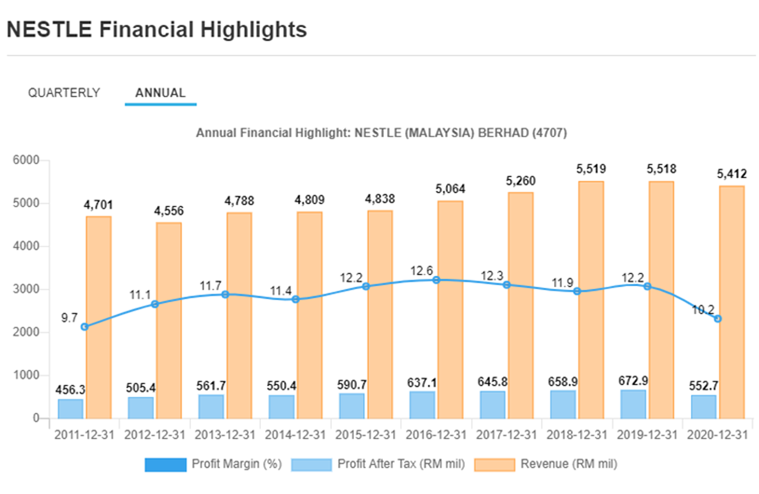
- Retained income: which may be used to pay off debts or invested in other companies. Petronas maintained earnings (see graph) that were far higher than those of Nestlé Malaysia Bhd in 2020 and 2019. As previously stated, retained companies typically prosper more consistently (Gordon, 1959).
Conclusion
Comparing the capital framework of PETRONAS and Nestle Malaysia, we can easily ascertain why both firms are approached differently to finance their development and operations both in 2020 and in 2019. This has been agreed after examining the firms’ debt ratio. As we have shown, Petronas had a capital structure ratio of 0.15 and 0.42 , and Nestle had a ratio of 0.17 and 0.27 in 2020 and 2019. We could determine that Petronas is a low equity firm, because as a source of financing for its business, it relies more upon equity than debt. Nestle is, on the other hand, seen as a high gear business that more relies on their financial long-term debts.