


Abstract
The thesis deals with two aspects of management which are leadership styles and employee’s commitment level.
The study was conducted in 2 construction and building materials companies which are Crown pump Ltd. (25 employees) in the Dubai branch and Al Mamoura General Trading (35 employees) in the Satwa branch in Dubai. The population size equals to 60 and the sample size equals to 49.
When taking leadership in consideration, then transformational, transactional and laissez-faire is studied thoroughly in this paper. The “multi-factor leadership questionnaire” was used to determine the leadership styles and Allen and Meyer’s model of employee commitment to their organization is used for this study which involves different types of commitment. They are affective, normative and Continuance commitment.
A conclusive research design was carried out by the researcher where surveys were used as the research instruments. The researcher emailed the survey link to the Finance manager who in turn passed it on the employees of the organization. 49 employees out of a sample of 60 filled out questionnaires based on leadership and commitment.
The researcher used SPSS student version 1.4 to analyze the data by using Pearson correlation (two-tailed) to test the hypothesis, using Cronbach alpha to test the reliability and other statistical tools were also used.
The results showed that transformational leadership style has a negative correlation with continuance commitment but has a positive,weak correlation with affective commitment. In both the cases the null hypotheses Ha3 and Ha1 were accepted. The association with normative commitment is positive and weak but has a stronger connection comparatively to others.The null hypothesis was not accepted and instead H2 was accepted.
Transactional leadership style has a negative correlation with affective and continuance commitment but a positive correlation with normative commitment. However, in this case the three null hypotheses which are Ha4, Ha5 and Ha6 were accepted.
The results showed that there was a positive correlation between Laissez-faire leadership style and the commitment levels where all three null hypotheses Ha7, Ha8 and Ha9 were not accepted. It had a weak association but a stronger connection with affective commitment.
Time and resource constraint caused the research to have limitations on data collection with a sample size and few variables.
Chapter 1
Introduction
- Company’s Profile
The researcher has taken convenient random sampling of 2 companies in Dubai that deals with construction and building materials. These businesses are located in Dubai Satwa district and Dubai Awir district. They are named as Al Mamoura General Trading ltd., and Crown pump ltd.These businesses are privately owned and they perform the functions of a wholesaler and retailer by providing building and construction materials to customers and clients. Apart from selling building materials, they also specialize in selling hardware items, electrical supplies, sanitary ware, toiletry pumps and paints. The organization is divided into functional departments that specialize in different fields of marketing, finance and management.
- Statement of the Problem
The researcher wants to know which leadership style is dominant in the 4 chosen construction and building materials companies in Dubai. Moreover, the researcher wants to know whether the leadership style being practiced has any connection with commitment level of the employees.
- Objectives of the Study
- To find out the demographic profile of the respondents in terms of age, and gender.
- To assess the dominant leadership style practiced in construction and building materials companies in Dubai.
- To find out whether there is a connection between leadership styles and level of employee commitment.
- Hypothesis
Based on the above mentioned objectives and statement of the problem, the researcher has come up with the following nine hypotheses:
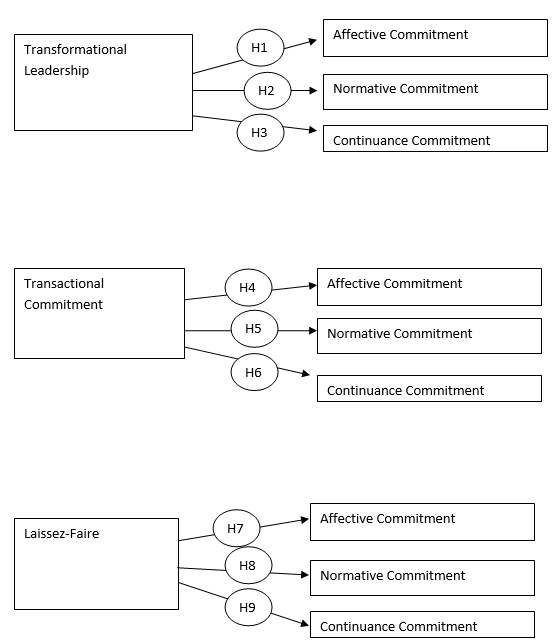
H1: Transformational leadership has a significant impact on Affective commitment.
Ha1: Transformational leadership has no significant impact on Affective commitment.
H2: Transformational leadership has a significant impact on normative commitment.
Ha2: Transformational leadership has no significant impact on normative commitment.
H3: Transformational leadership has a significant impact on continuance commitment.
Ha3: Transformational leadership has no significant impact on continuance commitment.
H4: Transactional leadership has a significant impact on Affective commitment.
Ha4: Transactional leadership has no significant impact on Affective commitment.
H5: Transactional leadership has a significant impact on normative commitment.
Ha5: Transactional leadership has no significant impact on normative commitment.
H6: Transactional leadership has a significant impact on Continuance commitment.
Ha6: Transactional leadership has no significant impact on Continuance commitment.
H7: Laissez-faire has a significant impact on Affective commitment.
Ha7: Laissez-faire has no significant impact on Affective commitment.
H8: Laissez-faire has a significant impact on normative commitment.
Ha8: Laissez-faire has no significant impact on normative commitment.
H9: Laissez-faire has a significant impact on Continuance commitment.
Ha9: Laissez-faire has no significant impact on Continuance commitment.
Figure 1.1 shows the summary of the Hypothesis
- Scope and Limitations of the Study
There are several businesses in Dubai that perform the functions of wholesaling and retailing of building materials and construction work. These businesses would benefit a great deal in understanding leadership styles and employee commitment. The employee satisfaction level can understood in terms of employee commitment to the organization.
However, the research work conducted in this paper by the researcher is limited to one field of study which is the “Management” field. To the other researchers from different fields this paper would not be effective and useful.
As leadership is a vast topic and several leadership styles have to be examined. The researcher has chosen nine dimensions of three leadership styles and has studied the model of Bass and Avolio in detail. This limits the research work to the nine dimensions of leadership only excluding the other styles.
- Significance of the Study
The study aims at exploring a very lively issue of organizational accomplishment because leadership has outstanding effects on Human Resource performance in meeting organizational objectives.
The outcome of this paper would help find out the major leadership style practiced by the leaders and the level of commitment by the employees of building and construction Materials Company.The relationship along with course of action provided by the researcher would help the company make changes.
This research paper would be helpful to several stakeholders such as the government, competitors, suppliers and customers of the companies.
- Definition of Terms
- Leadership Styles: The method a person in authority adopts to guide, inspire, control and command those under him i.e. his followers or subordinates. There are several leadership styles that a leader exhibits. In this research paper, the researcher makes use of (Bass B. a., 1994) leadership style.
- Employee’s commitment: The factor that encourages or discourages employees to stay or leave in the organization they are working in is employee commitment. Several factors contribute to what makes an employee committed to the organization he/she works in. These could include interpersonal relationships, bonuses, salaries etc
Chapter 2
Review of related literature
2.1 Conceptual Literature
Leadership Theories
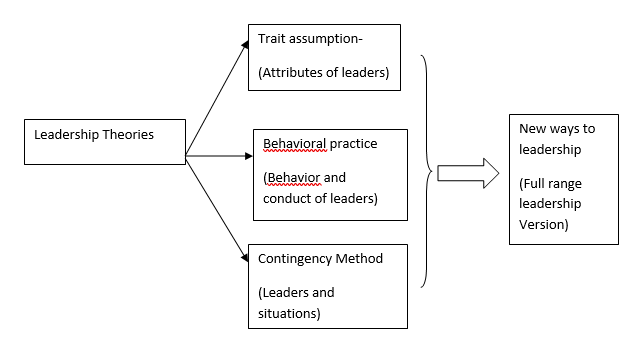
Figure 2.1: The fundamental ways to leadership
The researcher has described the above figure to provide an understanding of what leadership concept really is. The above figure shows that although there are several ways to know what leadership is but the best method would be the new approaches.
- Trait assumptions:
It is believed that what makes an individual a leader is the characteristics he/she possess. Different researchers have come up with different attributes to explain this. According to (Stogdil, 1948), “intelligence”, “Alertness”, “responsibility”, “initiative”, “persistence”, “self-confidence” makes up the qualities that a leader should have. Other researchers like (Lord, 1986) believe that it is the manliness, cleverness and supremacy that make up the qualities of a person in charge.
Many researchers believe that these qualities are innate and inherent. But there are several disparagement to this method. There are reliable set of qualities that can make a distinction between normal individuals and those who can lead (Stogdil, 1948). This approach does not succeed in simplifying the absolute of individuality (Tosi, 1986).
- Behavioral Practice:
This focuses on the behavior that people in authority show and display. This method pays attention to the acts and deeds of people rather than their personality. It looks at the accomplishments of people in charge rather than how others perceive them to be (Halpin, 1957).
The important behavior styles are (Gregor, 1960) theory X and theory Y, where presumption X deals unconstructive leadership style and presumption Y deals with constructive leadership style. The second behavior model is the managerial Grid version of (Mouton, 1964) where there are two aspects of superior behavior which are “concern for people” and “concern for output”. This is related to the “people-oriented” and “task-oriented leadership.
In spite of this, it is believed that the conduct and performance of a leader might be suitable in some circumstances and not in all. The reason for this is that the behavior model does not tell what people in charge should do in every state of affair (Hellriegal, 2004)
- Contingency Method:
This method corresponds to leaders who are apt for different situations. This method affirms that there is one leadership version which goes with all state of affairs (Gerber P.D., 1996). This method takes a different view where a leader is seen in concurrence with the conditions in which he/she works at (Fiedler, 1978).
In (Fiedler, 1978) contingency model, it is believed that efficient crowd presentation relates to the qualities of the leader and the circumstances. There has to be a pleasant relationship between the two.
(Hersey, 1977) The situational theory suggested was that a person in authority must alter their conduct in accordance to the development and understanding of their followers. Here leaders can display a “directive behavior” where exchange of ideas can be in one direction i.e. from the leader to the followers, or a “supportive behavior” where the exchange of ideas goes in both directions.
The problems with this method are that it did not succeed in giving a collective and widespread standard towards leadership(Bass B. , 1990). The connection between state of affairs and the ways have not been told clearly(Rice, 1978)
- New Method:
(Burns, 1978) In the beginning when leadership was being studied thoroughly, few concepts of the styles were brought up. These styles were of two types which were transformational and transactional. Later on some additions were made to this theory by (Bass, 1985).
Burns stated that transformational leadership style has more to it than then the normal conventional leadership styles. He was of the opinion that greater needs of individuals have to be focused on rather than the normal low level needs. (Burns, 1978) also believed that these leaders tell their subordinates what the vision and mission of the organization is. Due to this, the subordinates value their services. Moreover, they acknowledge what their responsibilities and roles are.
The additions made to the concepts of the two leadership styles suggested by Burns initially, was by (Bass B. a., 1997). They were of the opinion that a superior can display both leadership styles depending on the circumstances and situation. Bass suggested that there are seven variables of a leader and he used a multi leadership questionnaire (MLQ) to be filled out by the followers of the leader. However, after several criticisms nine factors were used instead of seven. Transformational leadership style has a range of styles which are five in number. They are named as “idealized influence attribute”, “idealized influence behavior”, “inspirational motivation”, “intellectual stimulation” and “idealized consideration”. The three extensions of transactional leadership styles are named as “contingent reward”, “management by exception active” and “management by exception passive”. The third leadership style is “laissez faire” which has another name. The other name for it is “non-leadership”. According to Bass, the person in authority would display each of these styles in combination.
According to (Avolio, 1990)Transformational leaders are capable of inspiring motivation in their followers who in return provide excellent performance and reach the organizational goals. Idealized influence attributed is when a leader shows charisma in his attributes whereas idealized influence behavior is when a leader displays appeal and charisma in his behavior. Inspirational motivation means that the leader is able to bring about feelings of optimism and enthusiasm in the employees. The followers of inspirational motivated leaders are all motivated because the leaders motivate them. Intellectual motivated leaders are able to make their team creative and they cause creativity to rise and surface in their team. Individualized consideration is when the leader possesses the ability to pay individual attention to each subordinate and encourage two way communications.
In transactional leadership style, contingent rewards are when a leader promises to pay reward to the employees upon the completion of work. Management by exception-passive means the leader waits for errors to occur and then only action is taken. They are not pro-active. They take necessary actions only after the occurrence of blunders. Management by exception active leaders is those people who are pro-active. These leaders are able to exercise control on errors and deviances from norms before they could even occur.
The last type of transformational leadership style is non-leadership which is laissez-faire. In this leadership style, the leader gives complete freedom to the employees. The leader avoids making decisions. Here, there is absence of leadership.
2.1.2 Organizational commitment:
According to Allen and Meyers, the commitment an employee displays and has towards the organization can be of three different types which are as follows:
- Affective Commitment: Employees chose to stay in the organization at their own will and this decision is taken up entirely by them. They are attached to the organization at an emotional level (AllenN.J., 1990).
- Normative Commitment: Employees stay at the organization because they feel that they responsible and ought to stay committed (Allen, 1996).
- Continuance Commitment: Employees chose to stay and continue working in the organization because they have no other option. They consider the costs of not being the organization being too great (AllenN.J., 1990)
- Related Studies
Leadership styles
Leadership is all about bringing certainty and agency to those individuals who are required to attain the objectives of the organization(Kim, 1992). The leadership styles are a mixture of both the qualities of mental outlook and manner of conducting oneself which leads to regularity in handling the members of a group(Dubrin, 2004).
According to (Rad, 2006) a leader may accomplish tasks effectively in one situation but in another, he may be productive. The other styles are “autocratic”, “democratic”, “bureaucratic”, “laissez faire”, “charismatic”, “participative”, “situational”, “transactional”, and “transformational” leadership styles. Each leadership style is effective and is needed in different circumstances and a leader must know how to use one definite style in the right situation.
Leadership has several definitions and according to Stodgily, it is a process where the leader does not intimidate his team members to reach the target provided. He does not make use of force to direct the work of his members. Leadership can be a property where the qualities enable the leader to influence others. However, this definition does not consider all aspects of being a leader because leadership is not restricted to the qualities an individual possess. There is more to this. Leadership is also about what actions one takes and how far one can go to do something. Leadership can be used to describe some act, a person or both.(Jago, 1982).
For leadership to be effective, it is imperative that one individual possess the ability to influence whilst the others possess the ability to get influenced easily. The word leadership can be related to the word “followership” where others are willing to follow a person who inspires and influences. (Jago, 1982). The researcher described leadership in a short story where he states that if one person in a theater shouts “fire”, he possesses the ability to influence many people’s lives. But an individual from amongst the crowd who takes control of the situation and directs the crowd exhibits leadership (Jago, 1982). The concept of leadership is not limited to one group or a few people; it is a driving and changing process that is growing constantly(Jago, 1982).
Leadership in an organization holds great significance and importance in the success and failure of the workplace and it can impact employee satisfaction in numerous ways. It is vital for every organization to appoint a leader to support and bring about a change. Prophet Muhammad (PBUH) stated that when three people are travelling and going on a trip, it is compulsory for them to appoint any one individual from amongst them as their leader(Dawud).
In a famous book called The Prince(Machiavelli, 1513) the author states that a prince has the privileges of being a fox and a lion at the same time. The qualities of fox such as cunningness and being deceptive should be adopted by the king. At the same time the qualities of a lion such as power, authority and control should be adopted side by side. Therefore, in the concept of Machiavellianism the prince should possess all the above mentioned qualities. Similarly, a leader should possess such qualities. Researchers and politicians have referred to his writings to understand the political dynamics in the workplace. Machiavellianism is used to describe a person who would behave immorally to obtain what he desires most. The very first offerings to be made to Niccolo Machiavelli’s writing were in 1967 by Jay where he contended that states and business organizations are the same creatures. Jay stated that Machiavelli’s work portrays the reality and truth.
Till date it can be seen that leadership is one topic to which a lot of notice has been given to and at the same time it cannot be understood that easily (Burns, 1978) The values, beliefs and assumptions of an organizational culture play a crucial role to the overall style of leadership adopted(Bunmi, 2007). Thorough studies have been conducted by past researchers to know the link between leadership styles, employee’s performance and motivation.
There are several forms of leadership styles practiced in organizations. In autocratic leadership, the leader dominates and controls the employees to an extent that they portray passive resistance. They do not like being controlled and abhor such treatment. In such leadership styles the employees and the leader share a servant master relationship(Adair, 1984). In the laissez faire leadership style, the leader gives full authority to the subordinates to make suggestions and work in the best way they could. The employees are not controlled and dominated. But there is negligible direction to encourage employees at work(Bittel, 1989).
Different authors and researchers have different views about what leadership actually is. According to (Nicholls, 1988)it has more to do than just aspiring people. It is all about what and how individuals sense and believe and what links they have with their responsibilities, roles and assignments. Others such as (Bennett, 2009) believe that workplaces have to be active in making changes so as to be in coherence with the outer world. Workplaces need to focus more on long term goals rather than just simple operational daily tasks. He was also of the opinion that by paying attention to lies ahead for the organization would enable it to be more competitive and allow it to survive.
Every employee develops an outlook towards their work and this approach depends on how their overseer’s behavior. Based on this it is believed and unsaid that a number of control styles are more helpful in gaining employee dedication (Barker, 2007).
Transformational leadership:
Although there are several types of leadership, but the one which has a greater and deeper effect is transformational leadership style. Here the leader takes all the essentials of the supplementary into account. When it is examined in contrast with other beliefs and approaches such as situational theory, then it can be observed that this style provides a deep-seated insight into understanding what the employees really want but in situational theory, a superior performs and operate according to the place of activity, circumstance and the capability of the employees (Hautala, 2005).
According to (Burns, 1978), this leadership style is all about the synergy and communication between individuals and their superiors who help each other to elevate their inspiration and honesty. These inspirations and honesty are raised to common principles and purpose of action (Saqer, May, 2009). It surmounts the lack of simplification in earlier leadership concepts(Nyengane, 2007).
Here in this type of leadership, the leader shows all the qualities of the above mentioned theories. The leader demonstrates attributes related to authority and control, his manners and demeanor persuades the followers to work towards the given target, and their dealings and communication is impacted in many circumstances. Therefore, transformational leadership has features of all the above mentioned leadership styles (Hellriegal, 2004).
Such leaders promote and push their followers to aim at objectives that are long-standing rather than temporary. They are competent to develop the follower’s assortment requirements. Due to this the followers are not worried to achieve the low level needs of Maslow’s Hierarchy. They pay attention to the top level requirements like “self-actualization”. Moreover, the level of self-belief is raised in the members through the five constituents of this type of leadership. This along with the assortment in needs helps to modify organizational customs (Nyengane, 2007).
Transactional leadership:
Many researchers believe that this type of leadership has to do with the contact and dealings between the person in authority and the members. It is the “exchange relationship” between the two (Bass B. , 1990). Leadership dwells not in the individual or circumstances, but in the association and connection between subordinate and superior (Fields, 1989).
This leadership style has characteristics which are “contingent rewards” and “management by exception”. The former is when the superior gives his word to assign recompense to the supplementary upon the fulfillment of objectives whereas the latter is the when the superior makes sure that the supplementary makes no blunder (Bass B. a., 1997).
The superior provides assistance to the follower as what to do and how to do to get the recompense. Here, the source of encouragement to the followers is the fulfillment of the bottom rank needs of Maslow’s Hierarchy.
Laissez Faire
It can be seen above that transformational and transactional leadership mutually provide ways in tackling problems by not using the same methods. Laissez-faire is the other type of leadership which exists when the superior does not like getting mixed up in the process of making choices. Here the superior prefers not passing the judgment and he/she gives full liberty to his/her supplementary to do things the way they have always been done(Avolio, 1990).
Job Satisfaction:
Job satisfaction has several meanings and definitions. According to (locke, 1969), it is the relationship between what an individual desires from his job and what he gets in reality from it. It is the certainty and uncertainty that one feels in his job. This involves both the absolute and doubtful factors (Odom, 1990). Other people have their own views about job satisfaction. According to (Mosadeghrad, 2003), job satisfaction is the mental outlook, beliefs and approach one has towards his job and the workplace at which they are working. Various internal and external elements come to play when describing employee’s satisfaction. The elements could be salary, pay, promotions, benefits, infringements, the environment of the workplace, the conditions at the workplace, relationships with colleagues, supervision and the traditions of the organization(Misener, 1996).
Several factors contribute to employees being satisfied from their work. These include salaries, bonuses, pay, benefits, security, relationships, respect, organizational culture, the disposition of colleagues, and conversations at workplace (Spector, 1985).
According to (McNeese-Smith, 1999), employees do not feel encouraged and motivated to work with staffs who are not trained and who don’t know what t do in their jobs. Due to this reason there were high levels of absenteeism, unfulfilled expectations, and repeated work of tasks.
(Benkhoff, 1997) believes that turnover has a close connection two variables which are employee commitment and job satisfaction. He believes that when employees are happy from their work and the organization, they would not want to leave and switch their jobs but when employees are dissatisfied, they chose not to stay committed to the organization.
Employee commitment to the organization is a variable that the researcher has used in this study. The three component model of Allen and Meyer talks about three types of commitment an employee has towards the organization. The first is affective commitment, the second is normative commitment and the last is continuance commitment. It is vital to strengthen an employee’s affective commitment to an organization because according to (Blum, 2000) if this commitment is built and anchored in an employee, he would remain loyal to the organization. (Rhoades and Eisenberger, 2002) believe that if employees get the reinforcement they want from their organization then they would stay committed. (Grant, 2008) added light to this topic. He stated that when employees feel that their organization cares for them then they would stay and remain committed to their organization.
2.3 Synthesis:
The researcher has used three leadership styles in this paper. These are named as transformational, transactional and Laissez-faire. In total, these have ranges which when combined come up to a total of nine ranges. According to bass and Avolio, a leader can exhibit a combination of all three styles in different situations and circumstances. It is not a compulsion or a rule that all three can be displayed in one situation, a leader can exhibit transformational leadership style or transactional style. The existence of leadership which is laissez-faire can also be the case.
Different authors have different beliefs about what leadership actually is. Some believe that it is all about mesmerizing others while others feel that anyone can become one in different situations.
Moving on to Organizational commitment, it has three components suggested by(AllenN.J., 1990). The three components suggest that employees stay committed to an organization because they want to, need to or feel obliged to. These three reasons determine their level of satisfaction they derive from the organization.
The researcher is showing a link between the leadership styles practiced by the leader of the organization and how this can impact the employee’s satisfaction level. Each leadership style influences the satisfaction level of the workers.
Figure 2.2: The figure shows how leadership styles can have an impact on Employee’s commitment level in the organization
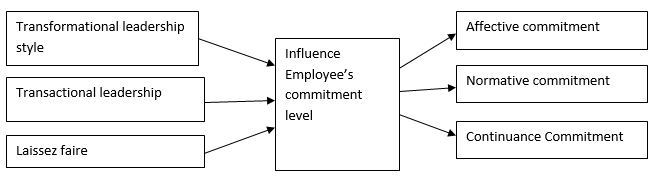
The diagram summarizes how the leadership styles practiced by leaders can influence the employee satisfaction level. The satisfaction of employees is determined by finding out what commitment level each employee exhibits to the organization.
Chapter 3
3.1 Research Design
The research design carried out in this paper was quantitative in nature where surveys were used as the research instruments. The researcher made use of the interactive media of internet where online surveys were emailed to the Finance manager of the companies. They passed the survey on to the respondents via email. The researcher did not go to the location physically.
The survey was divided into three parts where the first part consisted of demographic questions such as gender, age, and number of years worked in the organization. The second part consisted of questions that were linked to leadership styles and the third part consisted of question relating to employee commitment. A likert scale was used by the researcher to rate the questions.
The following table shows the questions used in the survey and its link to the leadership styles along with employee’s commitment to the organization.
Table 3.1 shows the code sheet for interpretation of Data using SPSS student version 4:
| No. | Questions | Types of leadership style | Leadership style |
| 1 | I have complete faith in my superior. | Idealized influence attributed | TM1 |
| 2 | I am proud to be associated with my superior and he has my respect. | Idealized influence attributed- | TM2 |
| 3 | My superior considers the needs of others over his own personal needs. | Inspirational Motivation- | TM3 |
| 4 | My superior helps me find meaning in my work. | Inspirational Motivation- | TM4 |
| 5 | My superior enables me to think about old problems in new ways. | Intellectual stimulation | TM5 |
| 6. | My superior provides me with new ways of looking at puzzling things. | Intellectual stimulation | TM6 |
| 7 | My superior gives me personal attention when I feel rejected | Individualized consideration | TM7 |
| 8 | My superior lets me know how I am performing at my work. | Individualized consideration | TM8 |
| 9 | My superior helps me to develop my strengths. | Contingent rewards | TS1 |
| 10 | My superior pays special attention to my needs. | Contingent rewards | TS2 |
| 11 | My superior clarifies the rewards I will get upon the successful completion of tasks. | Management by exception | TS3 |
| 12 | My manager told me what I have to do to be rewarded. | Management by exception | TS4 |
| 13 | My manager avoids getting involved in the decision making process. | Laissez-faire | LF1 |
| 14 | My manager allows me continue working in the same way as always. | Laissez-faire | LF2 |
Table 3.2 shows a Summary of Commitment Questions with item codes
| No. | Commitment level | Type of Commitment |
| 1 | I would be happy to spend the rest of my career with this organization. | AC1 |
| 2 | “This organization has a great of personal meaning for me”. | AC2 |
| 3 | “Right now staying with my organization is a matter of necessity as much as a desire”. | CC1 |
| 4 | “It would be very hard for me to leave my organization right now, even if I wanted to”. | CC2 |
| 5 | “My organization deserves my loyalty”. | NC1 |
| 6 | “I would not leave my organization right now because I have a sense of obligation to the people in it”. | NC2 |
The questions for organizational commitment were taken from (Mukherjee, 2004).
3.2 Respondents of the study
The respondents of the study were the employees of al Mamoura general trading ltd. company of Al Satwa branch and Crown Pump ltd. In Awir district Dubai. The population size of the sample was 60 employees in total. Out of 60 employees, 49 respondents were able to fill out the surveys on 21st March 2013. The surveys were not given to the employees physically. Random sampling was done.
3.3 Research Instrument
Close-ended questionnaire was used by in the study where the respondents were made to tell simple and easy questions based on leadership styles and employee commitment level. The survey had three parts in which the first part dealt with demographics such age, number of years the worker worked in the organization and gender of the individual. The second part had questions about (Bass B. a., 1997)leadership style while the third part dealt with questions about Allen and Meyer’s three component of organizational Commitment. In all the respondents were made to answer 23 questions.
3.4 Reliability and Validity of the Research Instrument
Three Jurors from SZABIST organization in the Academic city Dubai tested the validity of the surveys before it was sent to the employees of Al Mamoura general trading ltd. There was content and predictive validity. The reliability of the surveys was already done as it was taken from reliable source. The survey is reliable as it was taken from an authentic source online. The source of the survey from which the questions for leadership styles were taken is from (Bass B. a., 1997)and the questions for organizational commitment are taken from (Mukherjee, 2004). Therefore, the survey is reliable.
3.5 Data collection procedure
The data was not collected physically. The surveys were sent using the internet and the data was automatically collected on the website of surveygizmo.com. The collection took around a week and half time i.e. from 21st March-2013 to 31th-March-2013.
The researcher has made use of SPSS student version 1.4 to test the analyze the hypothesis by making use of correlations. Moreover, reliability tables, frequency tables, cronbach alpha and charts would be used as other statistical tools to analyze the data that has been collected. The Cronbach Alpha is a standard that measures the internal consistency of the surveys.
3.7 Analyzing the Hypothesis:
For this study, the researcher used Two-tailed Pearson Correlation analysis to find out if there is a link between leadership and commitment. This helps to evaluate the line like connection, the force and path between two variables. In this the coefficient “r” has degrees those changes from a positive to a negative value. These values tell the path of the association between the variables. If the value of “r” is closer to nil than the association isn’t strong and vice versa. The reason a two-tailed test is used because the researcher is sure about the relationships but doesn’t know which path the association would go to.
Table 3.3Summary of Pearson’s Correlation coefficient
| Pearson’s Correlation Coefficient “r” | Correlation |
| Less than 0.5 | Weak connection |
| 0.5 to 0.8 | Moderate connection |
| Greater than 0.8 | Strong connection |
Table 3.3 shows that an “r” value of any number near one means that there is a strong connection between the variables whereas a value near zero means that there is not a sound connection between the two. A positive value indicates that when one variable goes high then the other would also show the same change whereas a negative value indicates that a change in one does not lead to the same change in the other(Devore, 1993)
Table 3.4 Summary of Significance levels
| Significance “p” | Statistical significant correlation |
| Less than 0.05 | None |
| Greater than 0.05 | Yes |
(“Statistics help for students”)
The researcher would not accept the null hypothesis if the value of p<0.05 whereas the researcher would accept the null hypothesis if the value of p>0.05. When the p value is high, then it shows that the outcome obtained is not very reliable.
Reliability Analysis:
Table 3.5 shows the ratings of Cronbach’s Alpha reliability and its results
| Reliability result | Ratings |
| < 0.6 | Poor reliability |
| 0.7 | Acceptable |
| 0.8 | Good |
The researcher used Cronbach’s Alpha to measure the internal consistency of the survey which was given to the employees of the building and materials companies. As mentioned in table 3.5, ratings below and equal to 0.6 shows a poor association between the variables whereas ratings above are acceptable(Nyengane, 2007).
Chapter Four
Presentation, Analysis and Interpretation of Data
4.1 Reliability Statistics
Table 4.1 shows the Cronbach’s Alpha for the survey
| Cronbach’s Alpha | Cronbach’s Alpha Based on Standardized Items | N of Items |
| .710 | .909 | 20 |
In section 3.6.2, the researcher mentioned the ratings of the Cronbach’s alpha and from that it can be concluded that a value of 0.710 shows that the surveys given out to the respondents have an “acceptable” rating in terms of reliability.
Table 4.2below shows that the Cronbach’s Alpha is high i.e. 0.5 to 0.7 for the leadership factors which mean that they are consistent. As a result, the survey used by the researcher is a steadfast tool for evaluating all the three types of leadership styles.
Table 4.2 below also shows that the consistency of the questions of commitment is steadfast as the values for the factors are all 0.7 which is acceptable.
Table 4.2 Summary of Cronbach’s Alpha for “MLQ” and commitment aspects
| Scale Mean if Item Deleted | Scale Variance if Item Deleted | Corrected Item-Total Correlation | Squared Multiple Correlation | Cronbach’s Alpha if Item Deleted | |
| TM1 | 191286.72 | 5333.749 | .305 | .906 | .710 |
| TM2 | 191281.75 | 5372.479 | -.002 | .872 | .712 |
| TM3 | 191276.69 | 5357.418 | .100 | .737 | .711 |
| TM4 | 191272.03 | 5364.942 | .056 | .827 | .712 |
| TM5 | 191266.72 | 5350.092 | .182 | .696 | .711 |
| TM6 | 191197.17 | 2245.686 | .969 | 1.000 | .562 |
| TM7 | 191256.44 | 5320.997 | .374 | .741 | .709 |
| TM8 | 191251.78 | 5315.892 | .372 | .837 | .709 |
| TS1 | 191246.72 | 5343.121 | .178 | .693 | .710 |
| TS2 | 191185.86 | 2603.780 | .975 | 1.000 | .555 |
| TS3 | 191180.61 | 2590.759 | .976 | .999 | .554 |
| TS4 | 191231.42 | 5333.164 | .276 | .807 | .710 |
| LF1 | 191225.83 | 5442.429 | -.387 | .810 | .717 |
| LF2 | 191221.31 | 5359.247 | .084 | .612 | .711 |
| AC1 | 191216.58 | 5370.650 | .006 | .709 | .712 |
| AC2 | 191211.64 | 5350.066 | .137 | .885 | .711 |
| CC1 | 191206.50 | 5368.429 | .022 | .599 | .712 |
| CC2 | 191201.39 | 5361.559 | .059 | .762 | .712 |
| NC1 | 191197.08 | 5336.307 | .269 | .749 | .710 |
| NC2 | 191191.81 | 5339.304 | .247 | .789 | .710 |
Inter-Item Correlation Matrix
Table 4.3 Summary of Inter-Item correlation Inter-Item Correlation Matrix
| TM1 | TM2 | TM3 | TM4 | TM5 | TM6 | TM7 | TM8 | TS1 | TS2 | TS3 | TS4 | LF1 | LF2 | AC1 | AC2 | CC1 | CC2 | NC1 | NC2 | |
| TM1 | 1.000 | |||||||||||||||||||
| TM2 | .815 | 1.000 | ||||||||||||||||||
| TM3 | .659 | .735 | 1.000 | |||||||||||||||||
| TM4 | .705 | .732 | .646 | 1.000 | ||||||||||||||||
| TM5 | .641 | .541 | .476 | .537 | 1.000 | |||||||||||||||
| TM6 | .178 | -.133 | -.001 | -.061 | .092 | 1.000 | ||||||||||||||
| TM7 | .698 | .555 | .341 | .397 | .468 | .280 | 1.000 | |||||||||||||
| TM8 | .600 | .632 | .515 | .559 | .290 | .279 | .530 | 1.000 | ||||||||||||
| TS1 | .696 | .608 | .544 | .644 | .598 | .074 | .465 | .523 | 1.000 | |||||||||||
| TS2 | .185 | -.122 | .010 | -.048 | .086 | .999 | .291 | .293 | .076 | 1.000 | ||||||||||
| TS3 | .195 | -.121 | .003 | -.052 | .090 | .999 | .294 | .295 | .081 | .999 | 1.000 | |||||||||
| TS4 | .529 | .415 | .291 | .249 | .299 | .200 | .412 | .479 | .471 | .200 | .219 | 1.000 | ||||||||
| LF1 | .115 | .337 | .304 | .386 | .120 | -.445 | .076 | .262 | .217 | -.435 | -.443 | -.170 | 1.000 | |||||||
| LF2 | .518 | .488 | .289 | .421 | .404 | .001 | .373 | .203 | .458 | .001 | .001 | .254 | .358 | 1.000 | ||||||
| AC1 | .653 | .667 | .506 | .532 | .345 | -.104 | .502 | .422 | .399 | -.094 | -.088 | .502 | .268 | .474 | 1.000 | |||||
| AC2 | .707 | .654 | .470 | .530 | .448 | .022 | .562 | .561 | .483 | .029 | .041 | .701 | .248 | .407 | .746 | 1.000 | ||||
| CC1 | .108 | .102 | .134 | .173 | .347 | -.006 | .023 | -.150 | .237 | -.017 | -.010 | .064 | .214 | .326 | .087 | -.009 | 1.000 | |||
| CC2 | .520 | .497 | .310 | .520 | .421 | -.029 | .516 | .201 | .455 | -.029 | -.027 | .329 | .174 | .389 | .498 | .624 | .259 | 1.000 | ||
| NC1 | .522 | .571 | .551 | .394 | .581 | .189 | .357 | .435 | .411 | .185 | .187 | .282 | .031 | .360 | .373 | .361 | .262 | .292 | 1.000 | |
| NC2 | .622 | .611 | .502 | .637 | .533 | .137 | .455 | .535 | .604 | .137 | .140 | .402 | .279 | .438 | .549 | .562 | .276 | .605 | .667 | 1.000 |
The values for the inter-item correlation matrix should be less i.e. less than 1.00 and these values are obtained which can be seen from table 4.2 above. A less value signifies reliable results.
Statistics
Table 4.4 shows the mean, median and standard deviation for leadership and commitment factors
| N | Mean | Median | Std. Deviation | Percentiles | ||||
| Valid | Missing | 25 | 50 | 75 | ||||
| Gender | 49 | 0 | 1.35 | 1.00 | .481 | 1.00 | 1.00 | 2.00 |
| Age | 49 | 0 | 3.65 | 3.00 | .805 | 3.00 | 3.00 | 4.00 |
| TM1 | 49 | 0 | 8.24 | 8.00 | .879 | 8.00 | 8.00 | 8.50 |
| TM2 | 48 | 1 | 13.42 | 13.00 | .919 | 13.00 | 13.00 | 14.00 |
| TM3 | 49 | 0 | 18.39 | 18.00 | 1.017 | 18.00 | 18.00 | 19.00 |
| TM4 | 49 | 0 | 23.16 | 23.00 | 1.007 | 22.00 | 23.00 | 24.00 |
| TM5 | 47 | 2 | 28.32 | 28.00 | .862 | 28.00 | 28.00 | 29.00 |
| TM6 | 47 | 2 | 98.68 | 108.00 | 25.414 | 107.00 | 108.00 | 109.00 |
| TM7 | 48 | 1 | 38.50 | 38.00 | .968 | 38.00 | 38.00 | 39.00 |
| TM8 | 49 | 0 | 43.22 | 43.00 | 1.006 | 42.00 | 43.00 | 44.00 |
| TS1 | 45 | 4 | 48.36 | 48.00 | 1.090 | 47.00 | 48.00 | 49.00 |
| TS2 | 48 | 1 | 110.13 | 118.00 | 21.465 | 117.00 | 118.00 | 118.00 |
| TS3 | 46 | 3 | 114.98 | 123.00 | 22.082 | 122.00 | 123.00 | 124.00 |
| TS4 | 48 | 1 | 63.60 | 63.50 | 1.026 | 63.00 | 63.50 | 64.00 |
| LF1 | 49 | 0 | 69.06 | 69.00 | 1.314 | 68.00 | 69.00 | 70.00 |
| LF2 | 49 | 0 | 73.73 | 74.00 | 1.076 | 73.00 | 74.00 | 75.00 |
| AC1 | 49 | 0 | 78.55 | 78.00 | 1.138 | 78.00 | 78.00 | 79.00 |
| AC2 | 48 | 1 | 83.31 | 83.00 | 1.014 | 83.00 | 83.00 | 84.00 |
| CC1 | 48 | 1 | 88.50 | 88.00 | 1.052 | 88.00 | 88.00 | 89.00 |
| CC2 | 48 | 1 | 93.63 | 93.50 | 1.142 | 93.00 | 93.50 | 94.00 |
| NC1 | 48 | 1 | 97.94 | 98.00 | .976 | 97.00 | 98.00 | 98.00 |
| NC2 | 49 | 0 | 103.12 | 103.00 | .927 | 102.50 | 103.00 | 104.00 |
From Table 4.3 above, it can be seen that TM6 factor has the greatest standard deviation of 25.414 which is followed by TS3 factor which has a deviation of 22.082.
4.2 Demographic Data
The researcher has used age and gender to determine the demographic profile of the respondents.
Table 4.5 shows the Statistics Data for the Demographics of the Respondents
| N | Mean | Median | Std. Deviation | Percentiles | ||||
| Valid | Missing | 25 | 50 | 75 | ||||
| Q1 | 49 | 0 | 1.35 | 1.00 | .481 | 1.00 | 1.00 | 2.00 |
| Q2 | 49 | 0 | 3.65 | 3.00 | .805 | 3.00 | 3.00 | 4.00 |
The mean and median is used to evaluate the “central tendency”. In question 1, the mean has a value of 1.35 and the median has a value of 1.00 which indicates there the information is not asymmetric. The median is not very different from the mean and this show the absence of outliers. However, the standard deviation is 0.481 which shows the evaluation of dispersion.
In question no.2, the mean has a value of 3.65 and the median is 3.00. This shows that there were no outliers as the median did not greatly change from the mean. The standard deviation is 0.805 which is higher than that of question1. There is more dispersion in question no. 2 than in question no.1.
Q1. Gender
Table 4.6 shows the Summary of Statistics of Gender
| Frequency | Percent | Valid Percent | Cumulative Percent | ||
| Valid | Male | 32 | 65.3 | 65.3 | 65.3 |
| Female | 17 | 34.7 | 34.7 | 100.0 | |
| Total | 49 | 100.0 | 100.0 | ||
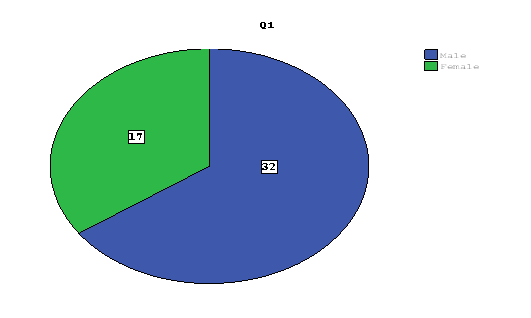
Table 4.6 shows that there are more male than females in the construction and building materials companies. There are 32 males which makes up 65.3 % and there are 17 females which makes up 34.7%.
Q2: Age
Table 4.7 shows a Summary of Statistics of the Age of respondents
| Frequency | Percent | Valid Percent | Cumulative Percent | ||
| Valid | 25-35 | 26 | 53.1 | 53.1 | 53.1 |
| 35-45 | 15 | 30.6 | 30.6 | 83.7 | |
| 45-55 | 7 | 14.3 | 14.3 | 98.0 | |
| 55-above | 1 | 2.0 | 2.0 | 100.0 | |
| Total | 49 | 100.0 | 100.0 | ||
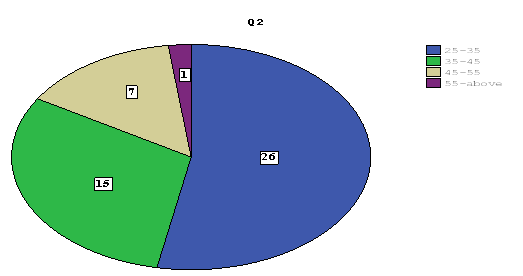
Table 4.7 above sows that majority of the respondents i.e. 26 out of 49 belong to the age group of 25-35 which makes up 53.1%. 15 respondents belong to the age group of 35-45 which makes up 30.6%. 7 respondents belong to the age group of 45-55 which makes up 14.3% and 1 belongs to the age group of 55 and above which makes 3%.
4.3Hypothesis Testing:
4.3.1 Hypothesis one:
H1: Transformational leadership has a significant impact on Affective commitment.
Ha1: Transformational leadership has no significant impact on Affective commitment.
Table 4.8: Outline of outcome for Hypothesis one
| TM | AC | ||
| TM | Pearson Correlation | 1 | .015 |
| Significance (2-tailed) | .926 | ||
| N | 43 | 42 | |
| AC | Pearson Correlation | .015 | 1 |
| Significance (2-tailed) | .926 | ||
| N | 42 | 48 |
Table 4.8above shows afragile positive correlation having a value of r= 0.015 and this indicates a negligible association between the two variables. The null hypothesize is accepted because the significance level “p” equals to 0.926 which is above 0.05.
4.3.2 Hypothesis 2:
H2: Transformational leadership has a significant impact on normative commitment.
Ha2: Transformational leadership has no significant impact on normative commitment.
Table 4.9: Outline of outcome for hypothesis two
| TM | NC | ||
| TM | Pearson Correlation | 1 | .340(*) |
| Significance (2-tailed) | .028 | ||
| N | 43 | 42 | |
| NC | Pearson Correlation | .340(*) | 1 |
| Significance (2-tailed) | .028 | ||
| N | 42 | 48 |
* “Correlation is significant at the 0.05 level (2-tailed)”
Table 4.9 above shows a fragile positive correlation where r=0.340 which indicates that there is a weak connection between transformational leadership and normative commitment. The null hypothesis is not accepted because the significance level is p=0.028 which is less than 0.05.
4.3.3 Hypothesis 3:
H3: Transformational leadership has a significant impact on continuance commitment.
Ha3: Transformational leadership has no significant impact on continuance commitment.
Table 4.10 Outline of outcome for Hypothesis three
| TM | CC | ||
| TM | Pearson Correlation | 1 | -.018 |
| Significance (2-tailed) | .912 | ||
| N | 43 | 41 | |
| CC | Pearson Correlation | -.018 | 1 |
| Significance (2-tailed) | .912 | ||
| N | 41 | 47 |
Table 4.10 shows that a negative correlation where r= -0.018 and this signifies that the two variables have a negligible connection. The null hypothesis is accepted because the significance level p=0.912 which is above 0.05.
4.3.4 Hypothesis 4:
H4: Transactional leadership has a significant impact on Affective commitment.
Ha4: Transactional leadership has no significant impact on Affective commitment.
Table 4.11 Outline of outcome for Hypothesis four
| TS | AC | ||
| TS | Pearson Correlation | 1 | -.017 |
| Significance (2-tailed) | .917 | ||
| N | 41 | 40 | |
| AC | Pearson Correlation | -.017 | 1 |
| Significance (2-tailed) | .917 | ||
| N | 40 | 48 |
Table 4.11 shows a negative correlation between the two variables. The value of the coefficient is r= -0.017 which shows a negligible connection between transactional leadership style and affective commitment.The null hypothesis is accepted because the significance level p=0.917 which is higher than 0.05.
4.3.5 Hypothesis 5:
H5: Transactional leadership has a significant impact on normative commitment.
Ha5: Transactional leadership has no significant impact on normative commitment.
Table 4.12 outline of outcome for Hypothesis five
| TS | NC | ||
| TS | Pearson Correlation | 1 | .166 |
| Significance (2-tailed) | .299 | ||
| N | 41 | 41 | |
| NC | Pearson Correlation | .166 | 1 |
| Significance (2-tailed) | .299 | ||
| N | 41 | 48 |
Table 4.12 shows a strong positive correlation between transactional leadership style and normative commitment because the correlation coefficient has value of r=0.166. However, the null hypothesis is accepted because the significance level is high which is p=0.299 which is higher than 0.05.
4.3.6 Hypothesis 6:
H6: Transactional leadership has a significant impact on Continuance commitment.
Ha6: Transactional leadership has no significant impact on Continuance commitment
Table 4.13 Outline of Outcome for Hypothesis six
| TS | CC | ||
| TS | Pearson Correlation | 1 | -.021 |
| Significance (2-tailed) | .897 | ||
| N | 41 | 39 | |
| CC | Pearson Correlation | -.021 | 1 |
| Significance (2-tailed) | .897 | ||
| N | 39 | 47 |
Table 4.13 shows a negative correlation between transactional leadership and continuance commitment where the coefficient has a value of r=-0.021 which indicates a negligible connection. This shows that when transactional leadership practices are increased then the continuance commitment towards the organization decreases. The significance level is p=0.897 which shows inconsiderable correlation. The null hypothesis is accepted in this case.
4.3.7 Hypothesis no. 7:
H7: Laissez-faire has a significant impact on Affective commitment.
Ha7: Laissez-faire has no significant impact on Affective commitment
Table 4.14 Outline of Outcome for Hypothesis seven
| LF | AC | ||
| LF | Pearson Correlation | 1 | .472(**) |
| Sig. (2-tailed) | .001 | ||
| N | 49 | 48 | |
| AC | Pearson Correlation | .472(**) | 1 |
| Sig. (2-tailed) | .001 | ||
| N | 48 | 48 |
** “Correlation is significant at the 0.01 level (2-tailed)”
Table 4.14 shows a weak positive correlation where the coefficient has a value of r=0.472 which indicates a very strong and positive connection between Laissez-faire and Affective commitment. The association between the variables is a significant one because the value of p=0.001 which is less than 0.05. The null hypothesis is not accepted here.
4.3.8 Hypothesis 8:
H8: Laissez-faire has a significant impact on normative commitment.
Ha8: Laissez-faire has no significant impact on normative commitment.
Table 4.15 Outline of Outcome for Hypothesis eight
| LF | NC | ||
| LF | Pearson Correlation | 1 | .327(*) |
| Significance (2-tailed) | .023 | ||
| N | 49 | 48 | |
| NC | Pearson Correlation | .327(*) | 1 |
| Significance (2-tailed) | .023 | ||
| N | 48 | 48 |
* “Correlation is significant at the 0.05 level (2-tailed)”.
Table 4.15 shows a positive but weak correlation between laissez-faire leadership and normative commitment because the value of the correlationcoefficient r=0.327.The significance level p=0.023 is less than 0.05 which shows a significant relationship between the variables. Therefore, the null Hypothesis is not accepted.
4.3.9 Hypothesis 9:
H9: Laissez-faire has a significant impact on Continuance commitment.
Ha9: Laissez-faire has no significant impact on Continuance commitment
Table 4.16 Outline of Outcome for Hypothesis nine
| LF | CC | ||
| LF | Pearson Correlation | 1 | .433(**) |
| Significance (2-tailed) | .002 | ||
| N | 49 | 47 | |
| CC | Pearson Correlation | .433(**) | 1 |
| Significance (2-tailed) | .002 | ||
| N | 47 | 47 |
** “Correlation is significant at the 0.01 level (2-tailed)”.
Table 4.16 shows a weak but positive correlation where the coefficient has a value of r=0.433. The significance level is 0.002 which is less than 0.05 which means that the null hypothesis is not accepted.
Chapter five
Summary of Findings, Conclusion and Recommendations
5.1 Summary of Findings
- The results showed that transformational leadership style has a negative correlation with continuance commitment where r= -0.018 and p=0.912. The null hypothesis was accepted here. It has a positive but weak correlation with affective commitment where r=0.015 and p=0.926. The null hypothesis was accepted. This leadership style has a positive and weak connection with normative commitment but a stronger connection comparatively to others where r=0.340 and p=0.028. The null hypothesis was rejected.
- Transactional leadership style has a negative correlation with affective and continuance commitment but a positive correlation with normative commitment. However, in this case the three null hypotheses which are Ha4, Ha5 and Ha6 were accepted. With affective commitment the results were r=-0.017 and p=0.917. With normative commitment the results were r=0.16 and p=0.299. With continuance commitment the results were r= -0.021 and p=0.897.
- The results showed that there was a positive correlation between Laissez-faire leadership style and the commitment levels where all three null hypotheses Ha7, Ha8 and Ha9 were not accepted. It had a weak association but a stronger connection comparatively to others, with affective commitment where r=0.472 and p=0.001. With continuance commitment, the results were r=0.433 and p=0.002. With normative commitment the results were r=0.327 and p=0.023.
5.2 Limitations:
Due to time and resource constraint, the research had limitations of data collection with a small size of 49 respondents and few variables. To make the research better, a larger sample size should be taken and more variables could be taken. This would help to generate effective results. The researcher only used the MLQ for the leadership styles. There are many other styles that could be studied.
In the future similar researchers can be conducted on a larger sample size which would help generate accurate outcomes.
5.3 Recommendations:
The researcher has come up with the following recommendations:
- The rules and regulations of the companies should be modified and improved so that supervisors and managers could adopt and practice transformational leadership style where the workers have knowledge about the values and objectives of the organization. They would know how to achieve the goals. This leadership style would help workers achieve the higher order needs in the Maslow’s hierarchy.The workers would be proud and loyal to their manager and the level of trust would be increased.
- A leadership training program can be introduced where the leaders are taught how to develop and enhance their leadership skills. This would help in organizational development.
- Build an environment of trust and include a participative decision-making process. This would help employee stay committed in the organization. Empower the employees by conducting training sessions on a regular basis. This would make the workers feel wanted and increase the affective and normative commitment.
- Developing a two-way communication would help problems and grievances be solved and this would encourage employees to stay committed to the organizations.
- Value and appreciate the work of employees and start recruiting internally before searching outside for the best employee. This internal recruitment and promotion would increase chances of affective commitment.
5.4 Conclusion:
It can be seen that Transformational leadership style is positively correlated with affective and normative commitment but negatively correlated to continuance commitment. The positive correlation is a weak one though. This shows that the leadership behavior involving trust, sharing the vision, encouraging inventiveness, problem solving in new ways, and acknowledging achievements all explain the reason why employees want to stay in the organization.
Transactional leadership style showed a positive weak relationship only with normative commitment and negative correlation with affective and continuance commitment. This indicates that there is no connection between transactional leadership style and affective and continuance commitment.
Laissez-faire leadership style I positively correlated to all the commitment levels which shows that employees like their freedom and enjoy working in a manner they want to. They enjoy making their own decisions.